
- Chart screen ke 5 hisse pehchan lena
- Upar bar: symbol, timeframe, chart type, Indicators
- Right price scale aur bottom time / timezone
- Beginner ke liye abhi kya ignore karna hai
Level: Bilkul aaghaz · Asset: Gold (XAUUSD) · Time: ~12–15 min
Chart screen kya hai?
TradingView khulte hi ek bada chart aata hai. Yeh screen 5 asaan hisso mein bat sakte ho. Abhi sirf pehchan — trade nahi, indicator nahi.
Step 1 — Poori screen: 5 hisse
Screen pe 5 cyan circles (1–5) dekho:
- Top bar — symbol, timeframe, chart type, Indicators
- Left tools — drawing (abhi skip)
- Chart area — candles (Gold ki price)
- Right price scale — price numbers
- Bottom time + timezone — dates aur New York time
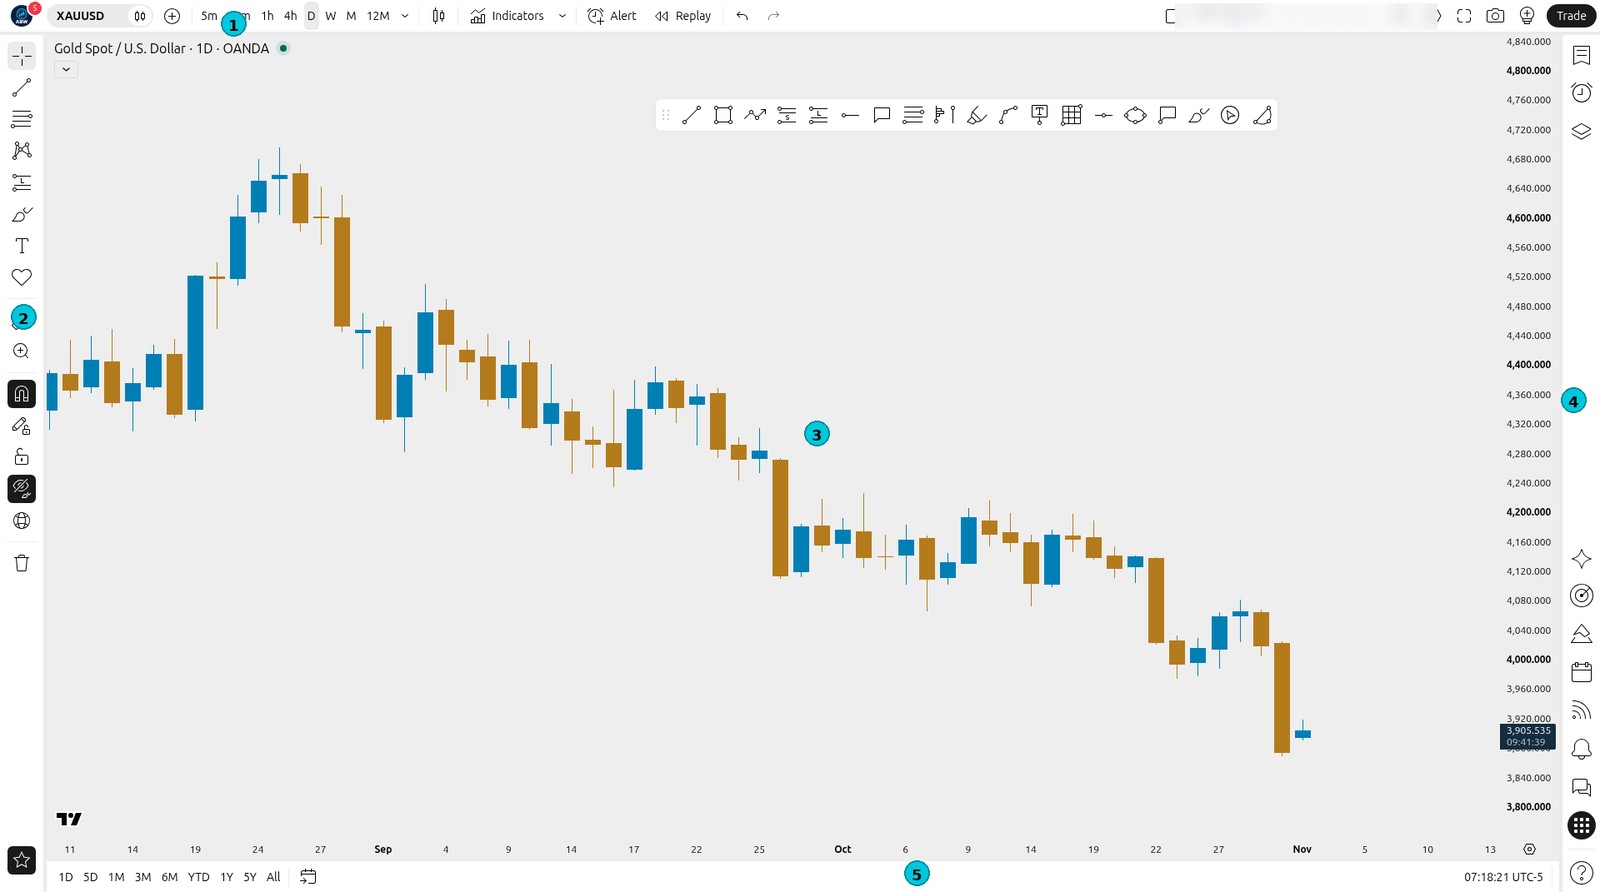
Pehle 1, 3, 4, 5 seekho. Circle 2 (left tools) abhi mat chhuao.
Step 2 — Symbol search (XAUUSD)
- Top bar pe XAUUSD dabao (circle 2)
- Search box khulta hai (circle 1)
- Likho:
XAUUSD - Gold Spot / U.S. Dollar choose karo
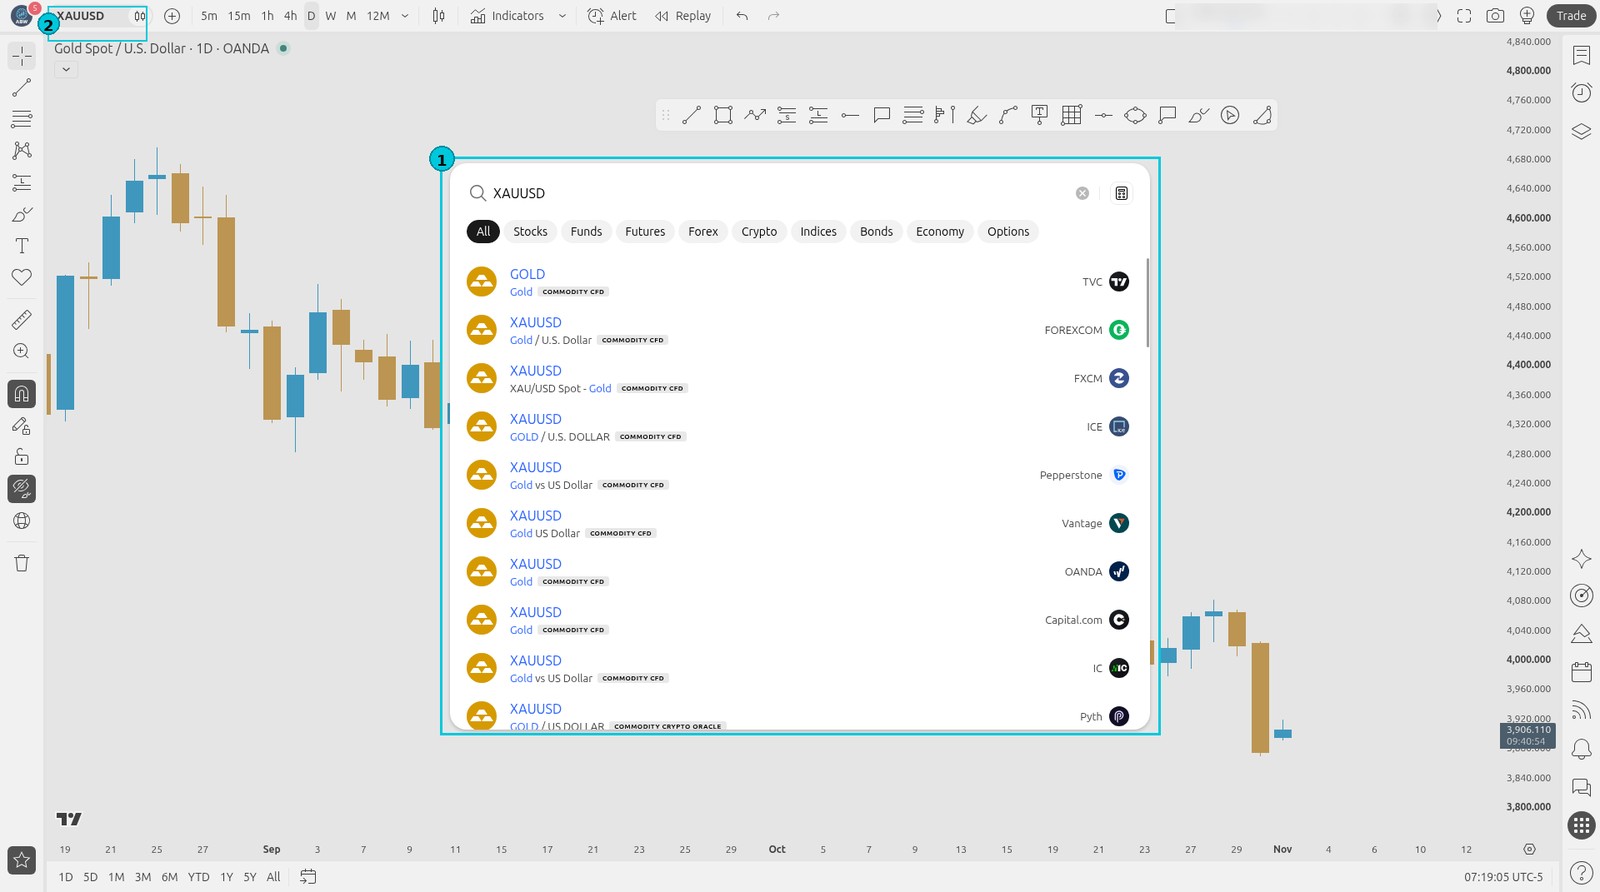
Yahi Gold chart hai. Symbol galat = price galat.
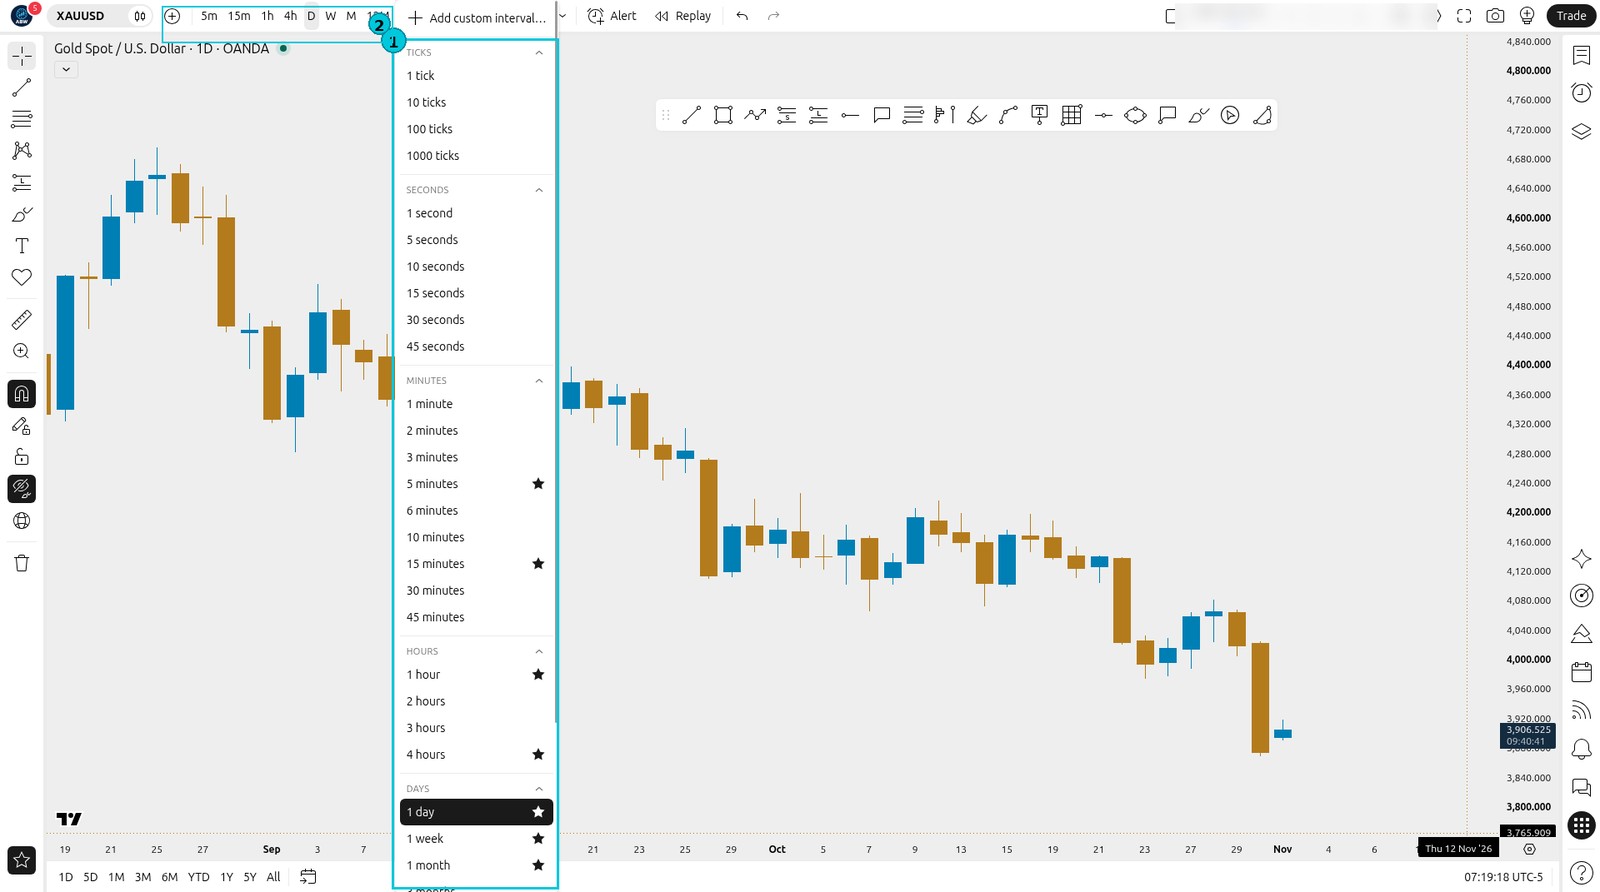
Step 3 — Timeframe menu
- Top bar pe
5m 15m 1h 4h Ddikhe - Arrow / list kholo — lambi menu (circle 1)
- Abhi D (1 day) choose rakho
Step 4 — Chart type (Candles)
- Top bar pe candles wala icon dabao
- Menu mein Candles select rakho (circle 1)
- Bars, Line, Renko — abhi ignore
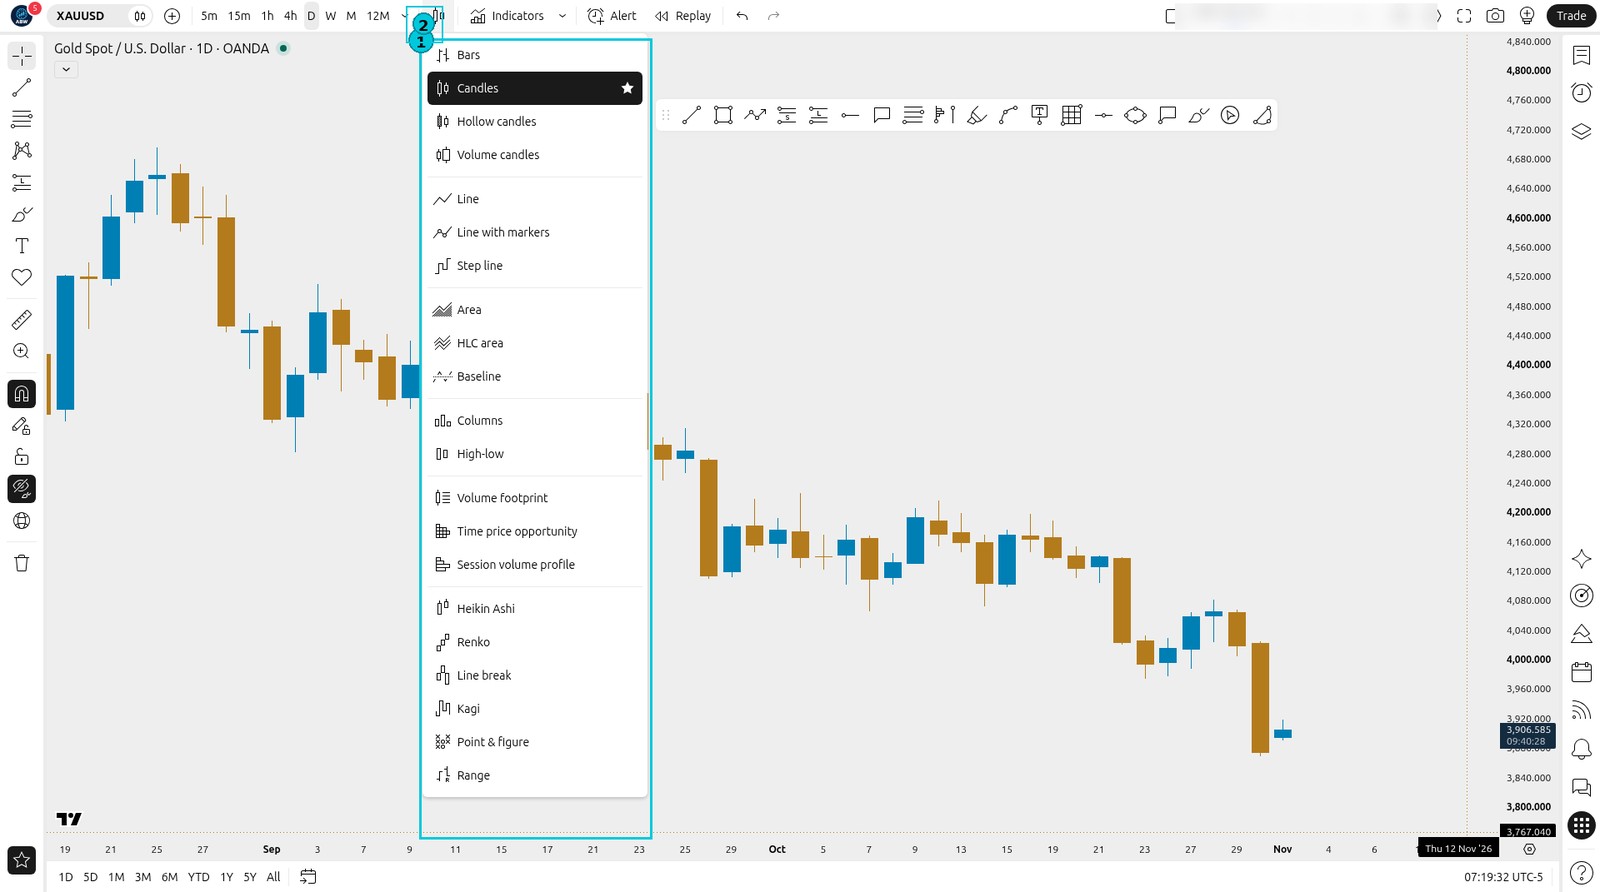
Is course mein sirf Candles.
Step 5 — Indicators button (abhi mat lagao)
- Top bar pe Indicators dikhe (circle 2)
- Click se dialog khulti hai (circle 1)
- List lambi hai — abhi kuch mat lagao
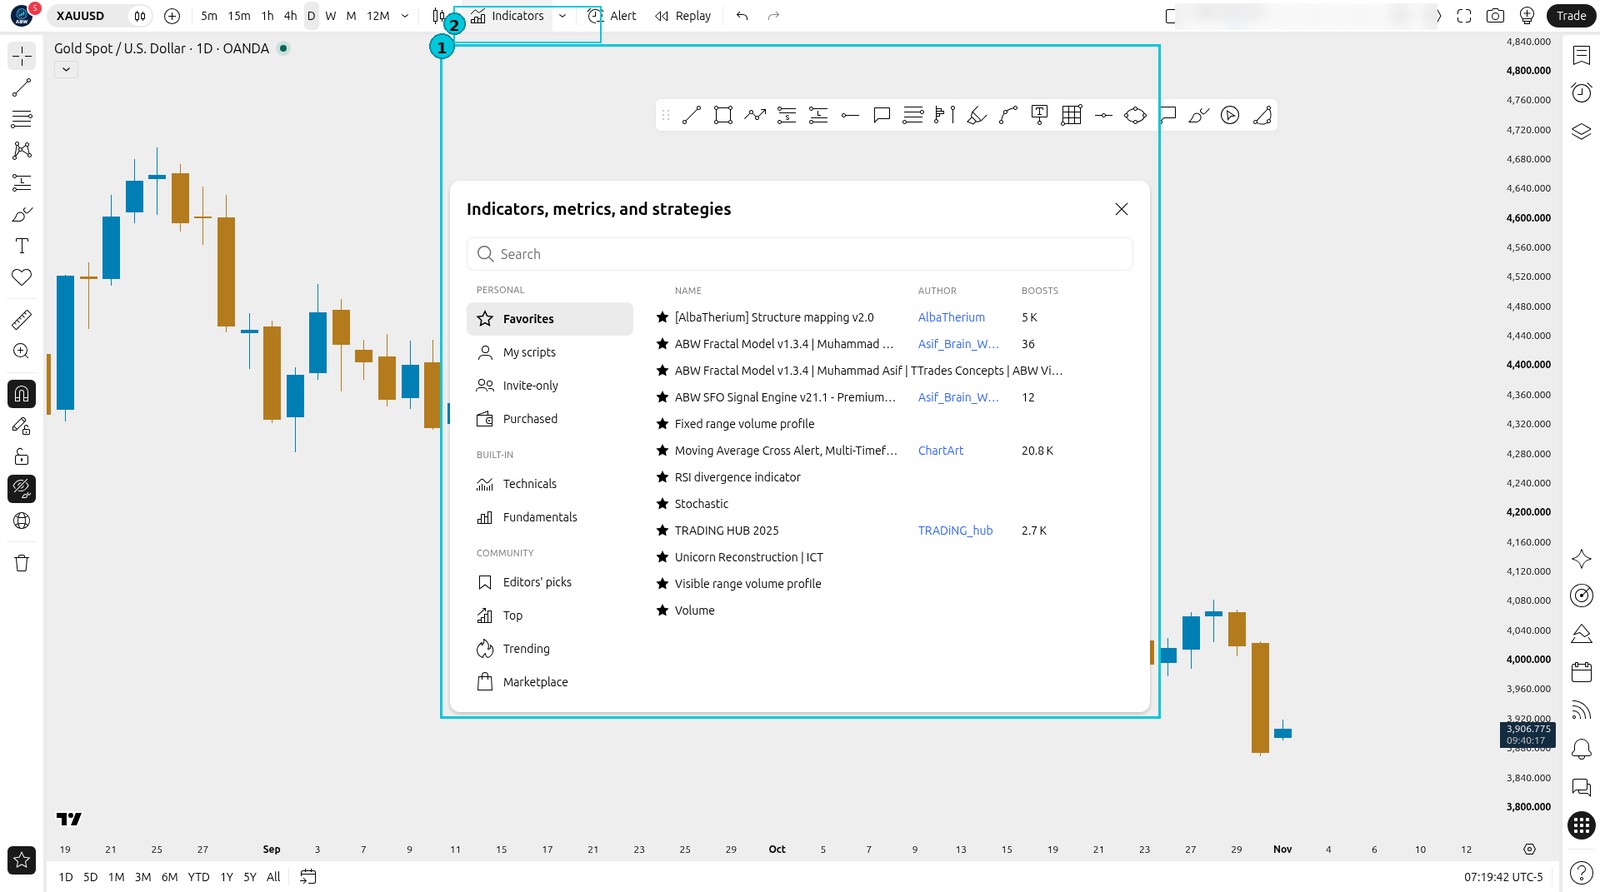
Pehle clean candles. Indicators baad ki lessons mein.
Step 6 — Price scale aur time scale
- Right = price scale (circle 1) — Gold ki price
- Bottom = time scale (circle 2) — dates / months
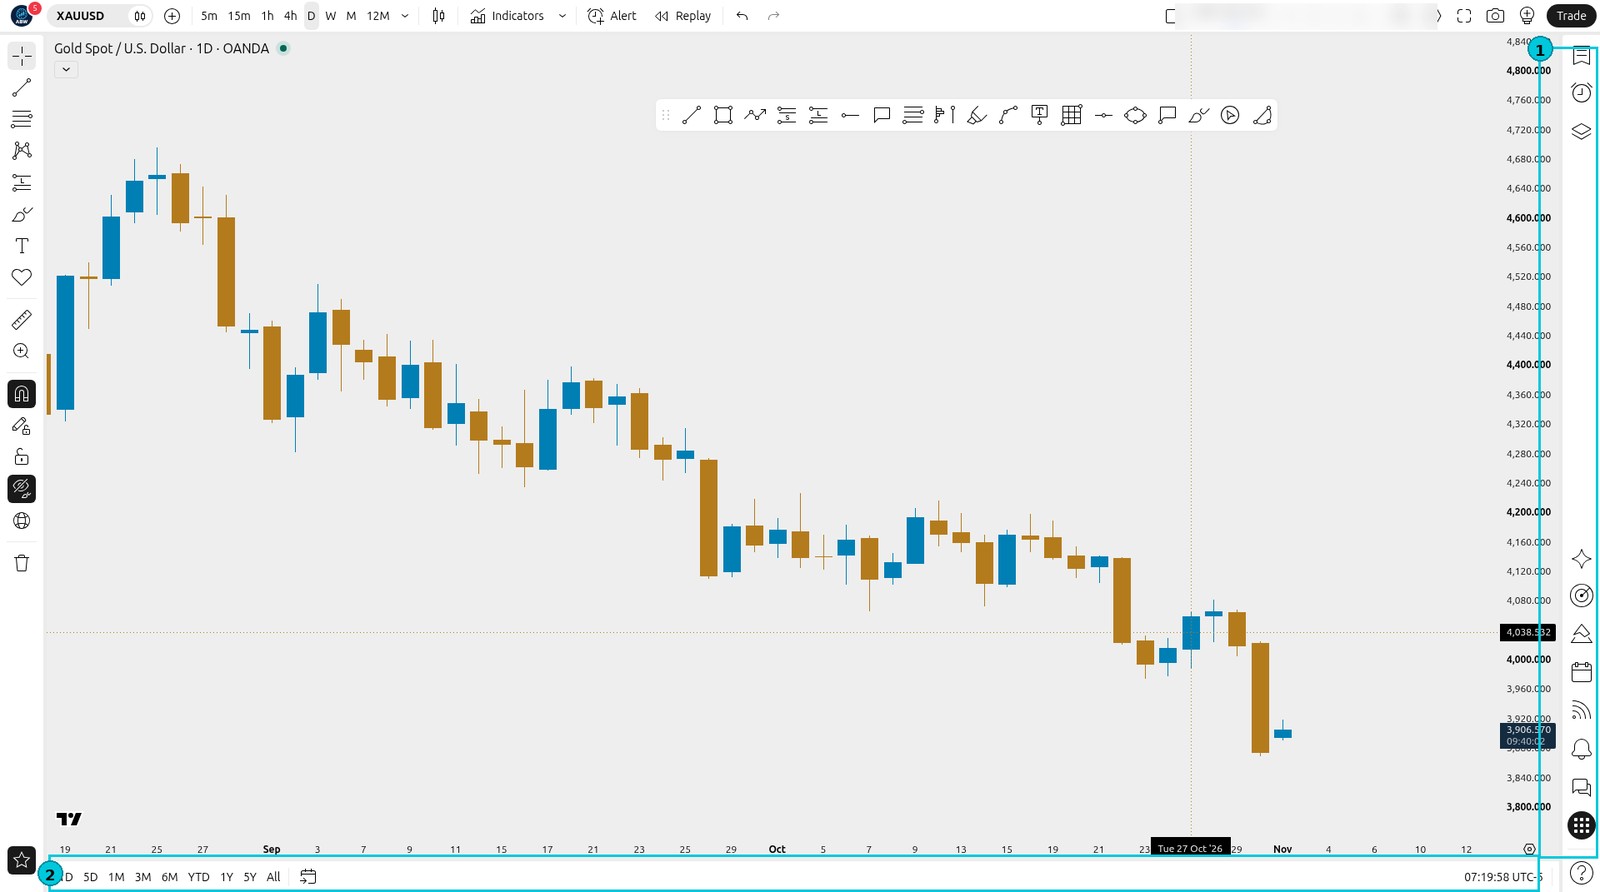
Price upar = mehnga. Time left = purana, right = naya.
Step 7 — Timezone (New York)
- Bottom-right pe time dabao (circle 2)
- Menu mein (UTC-5) New York tick hona chahiye (circle 1)
- Agar tick nahi — New York choose karo
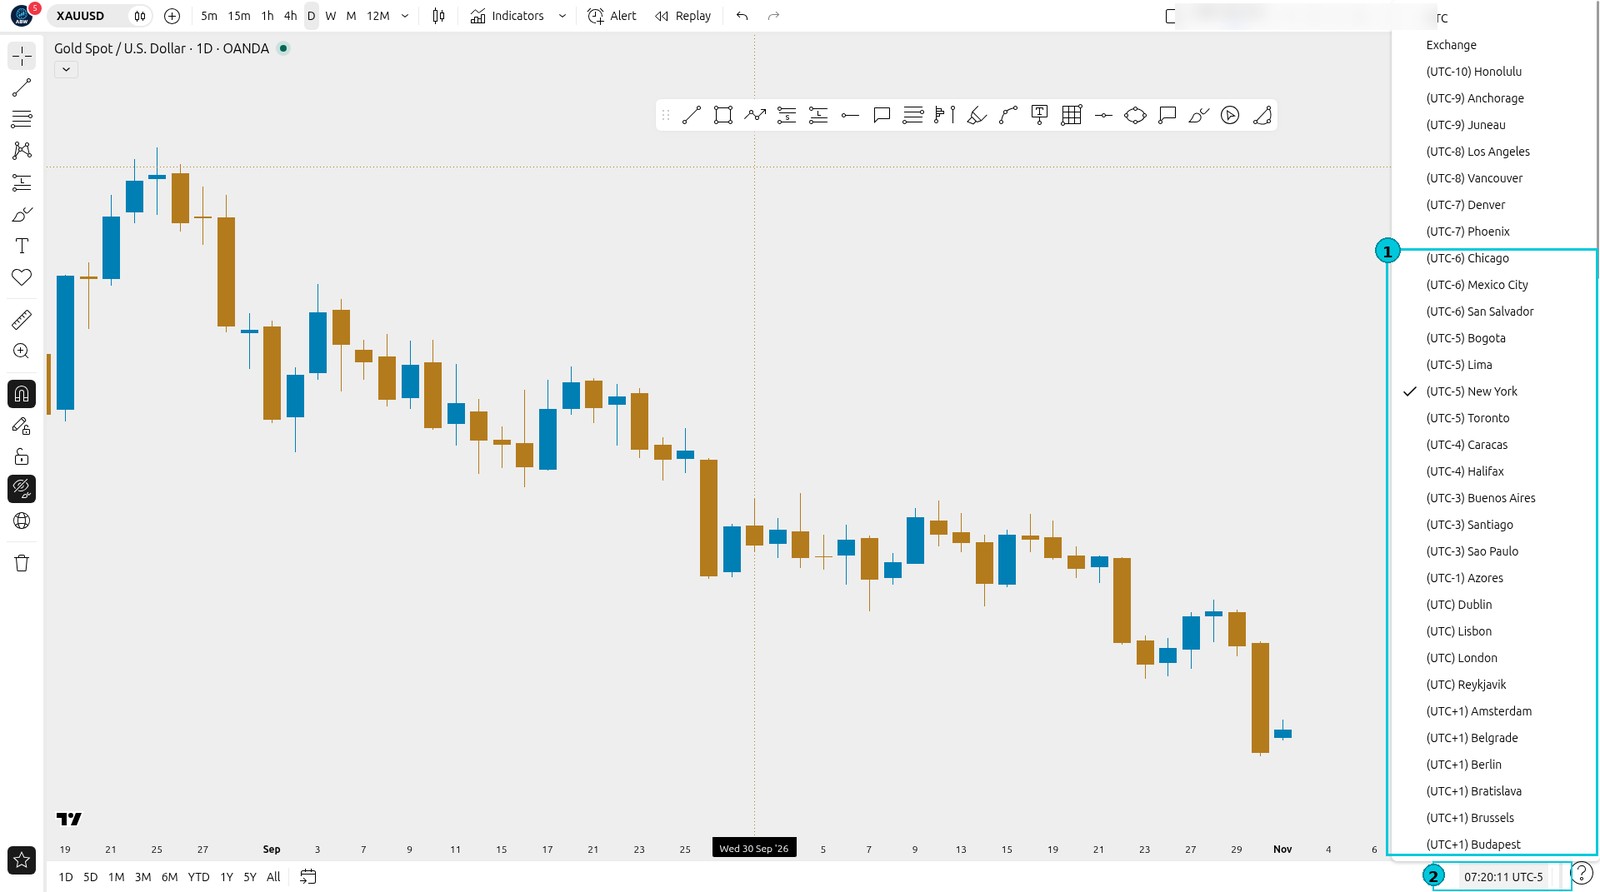
Timezone galat = candles ka “din” confuse.
Step 8 — Clean Gold chart (snapshot)
Yeh clean chart hai — sirf price, kam clutter. Neeche stamp: Asif_Brain_Waves (brand) — theek hai.
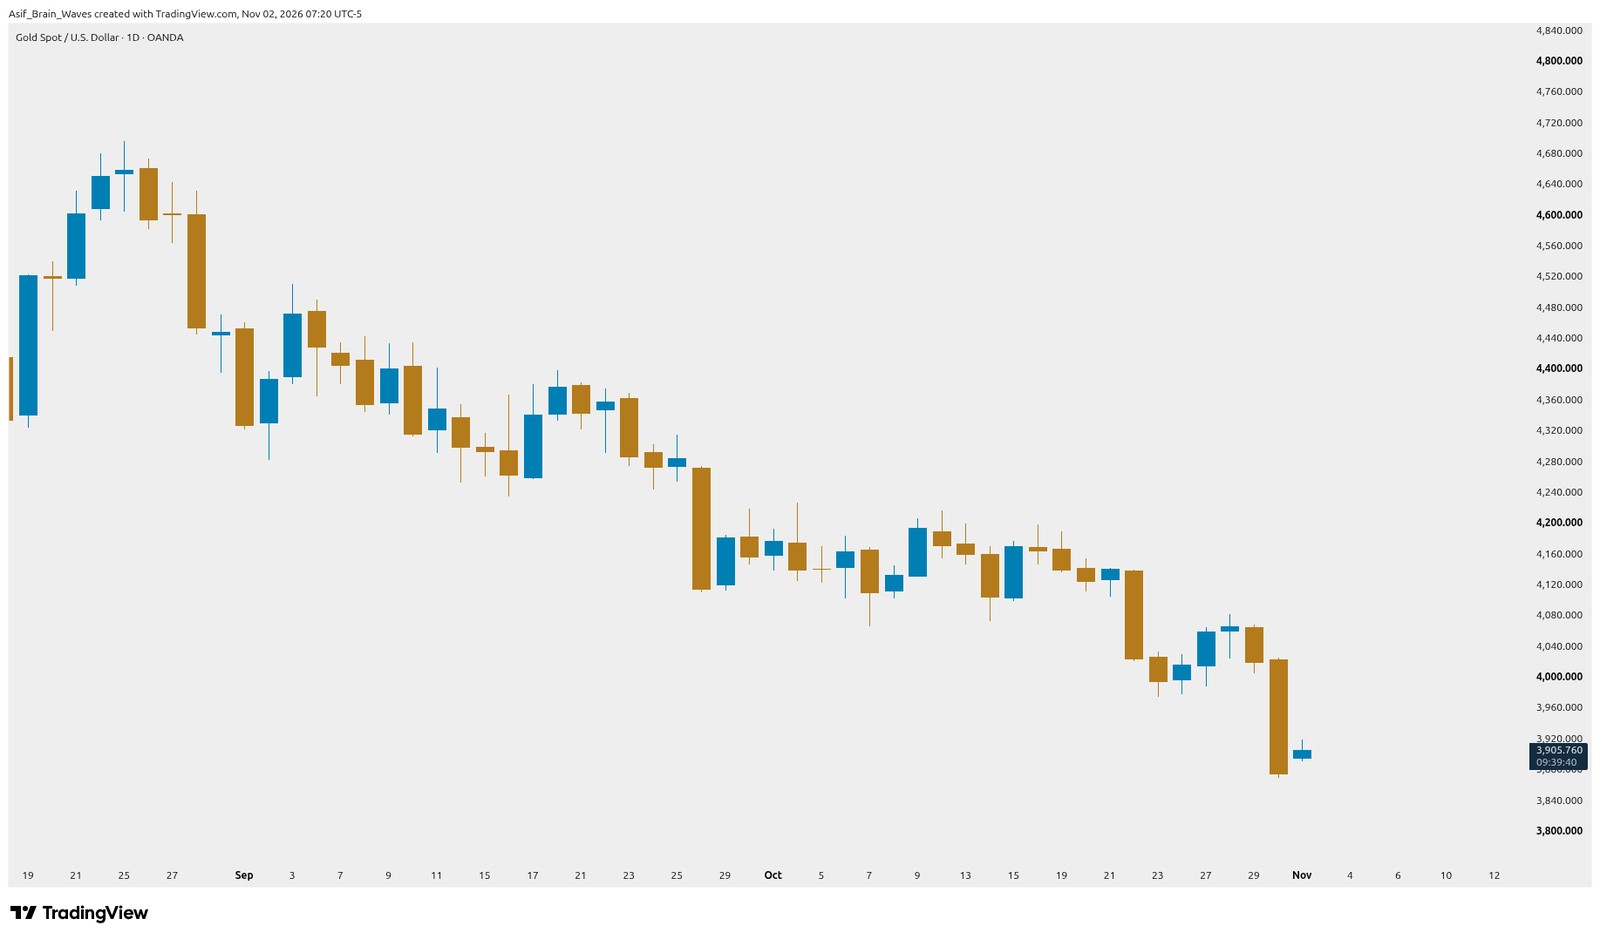
Apna chart bhi aisa clean rakho aaghaz mein.
Abhi kya ignore karna hai
- Left drawing tools (trendline, Fib, brush)
- Indicators / strategies dialog
- Alert, Replay, Trade button
- Watchlist / right side panels
- Layout name / Save (upar right)
Pehle: symbol + timeframe + candles + price + time.
- Timezone hamesha New York rakho
- Chart type = Candles
- Beginners: pehle D (daily) dekho
- Indicators khol ke band — lagana mat
- Screenshot mein poora chart + XAUUSD dikhe
- 5 hisse pehchan liye (top, left, chart, price, time)
- Symbol XAUUSD (Gold) dikh raha hai
- Timeframe D = 1 day samajh aa gaya
- Chart type Candles pe hai
- Indicators abhi nahi lagaye
- Timezone New York (UTC-5) tick hai
Task (ghar ka kaam)
Upload yeh screenshot:
- TradingView pe XAUUSD kholo
- Timeframe 1D (D), chart type Candles
- Timezone New York tick
- Indicators / drawings mat lagao — clean chart
- Screenshot mein 5 hisse clear hon: top bar, left tools, candles, right price, bottom time
- File: PNG ya JPG, size 8MB se kam
- Course form pe upload karo
Educational only — no profit promises.