
- Open, High, Low aur Close kya hain — har candle ke 4 prices
- Green (up) aur red (down) candle pe yeh 4 points kahan baithe hote hain
- TradingView pe exact OHLC numbers kaise padhte hain (legend + Data window)
- Badi candle ka OHLC uski chhoti candles se kaise banta hai (Lesson 4 Step 9 ka link)
Level: Bilkul aaghaz · Asset: Gold (XAUUSD) · Time: ~16–20 min
Har candle mein 4 prices chhupi hain
Lesson 4 Step 9 mein aap ne pehle se High / open / Close / Low ki lines dekhi thin.
Wohi 4 prices ab is lesson ka topic hain.
Har candle — chhoti ho ya bari — sirf 4 numbers se banti hai:
| Letter | Naam | Seedhi baat |
|---|---|---|
| O | Open | Candle shuru hone ki price |
| H | High | Us waqt ki sab se unchi price |
| L | Low | Us waqt ki sab se neechi price |
| C | Close | Candle khatam hone ki price |
Rang (green/red) sirf itna batata hai: Close Open se upar gaya ya neeche.
Step 1 — Pehle diagram se pehchano
- Neeche simple diagram dekho — yeh market data nahi, sirf pehchan
- Left green = UP candle · Right red = DOWN candle
- High hamesha sab se upar · Low hamesha sab se neeche
- Farq sirf body pe: UP pe Close body ke upar; DOWN pe Open body ke upar
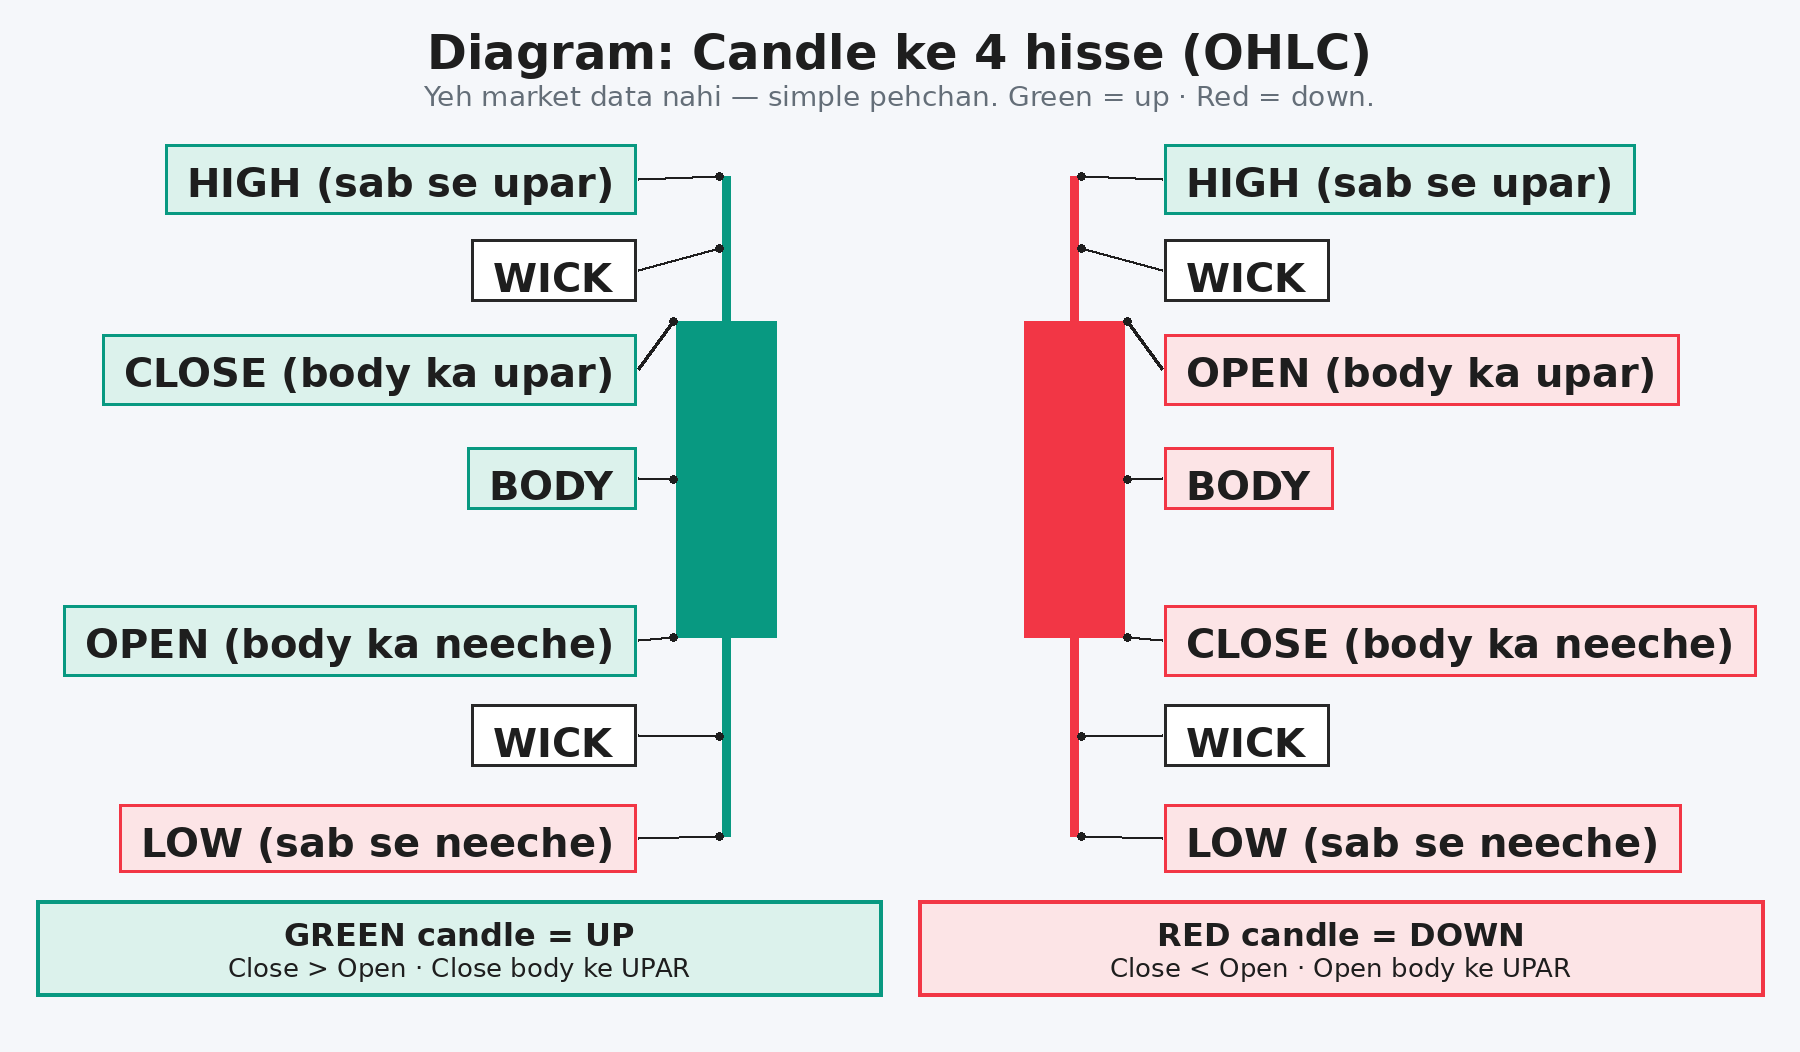
Is map ko yaad rakho. Ab asal Gold candle pe same 4 points dhoondhenge.
Step 2 — Green UP candle (asal chart)
- Gold (XAUUSD) 1D chart kholo
- Tue 27 Oct 2026 wali green candle pe hover karo
- Body ka neeche = Open · body ka upar = Close
- Upari wick tip = High · neechi wick tip = Low
Is candle ke numbers:
- Open 4,016.080
- High 4,065.700
- Low 3,989.160
- Close 4,060.330
Close > Open — is liye candle green (UP) hai.
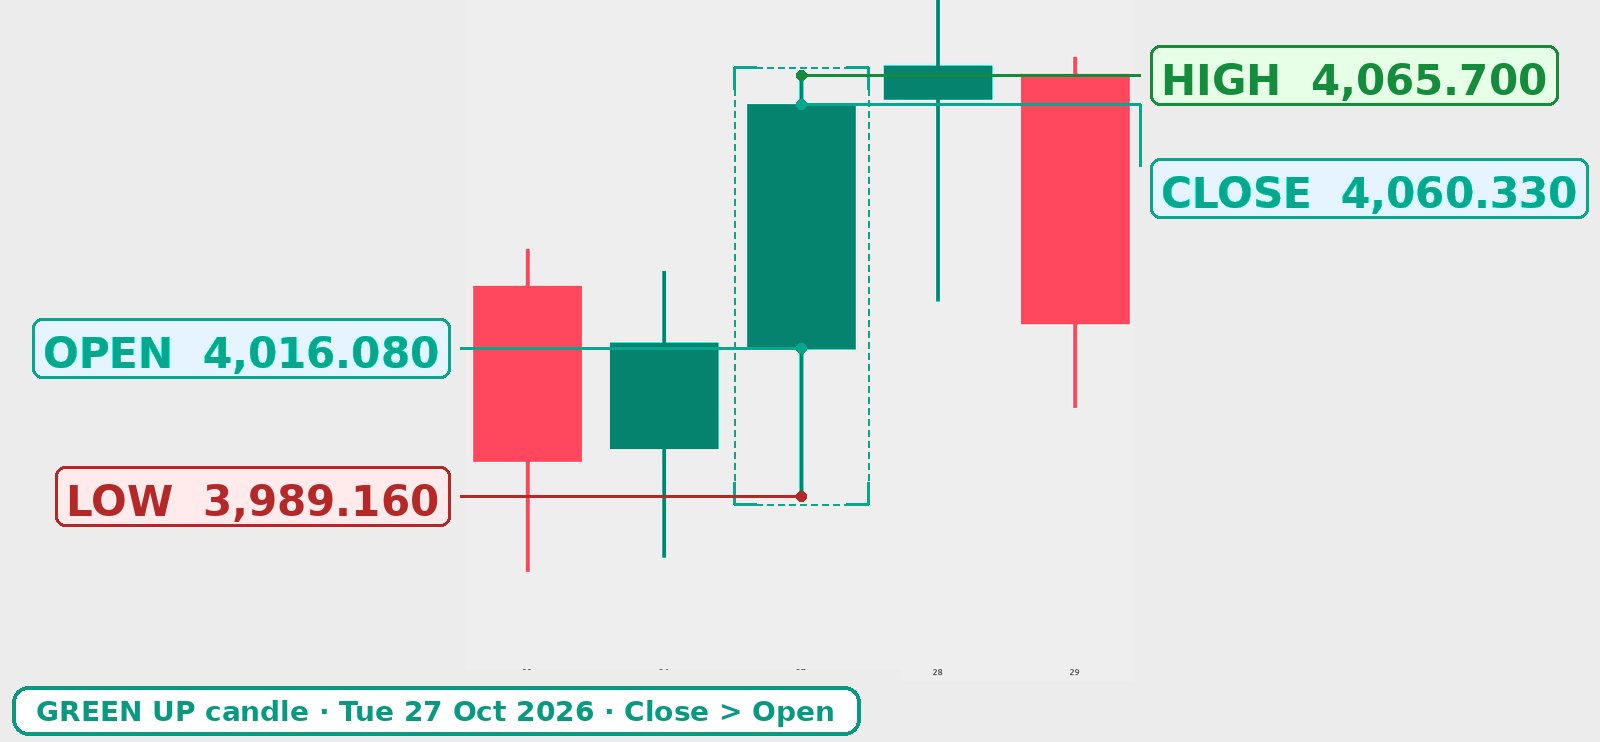
UP candle = buyers ne session jeet liya. Close Open se upar band hua.
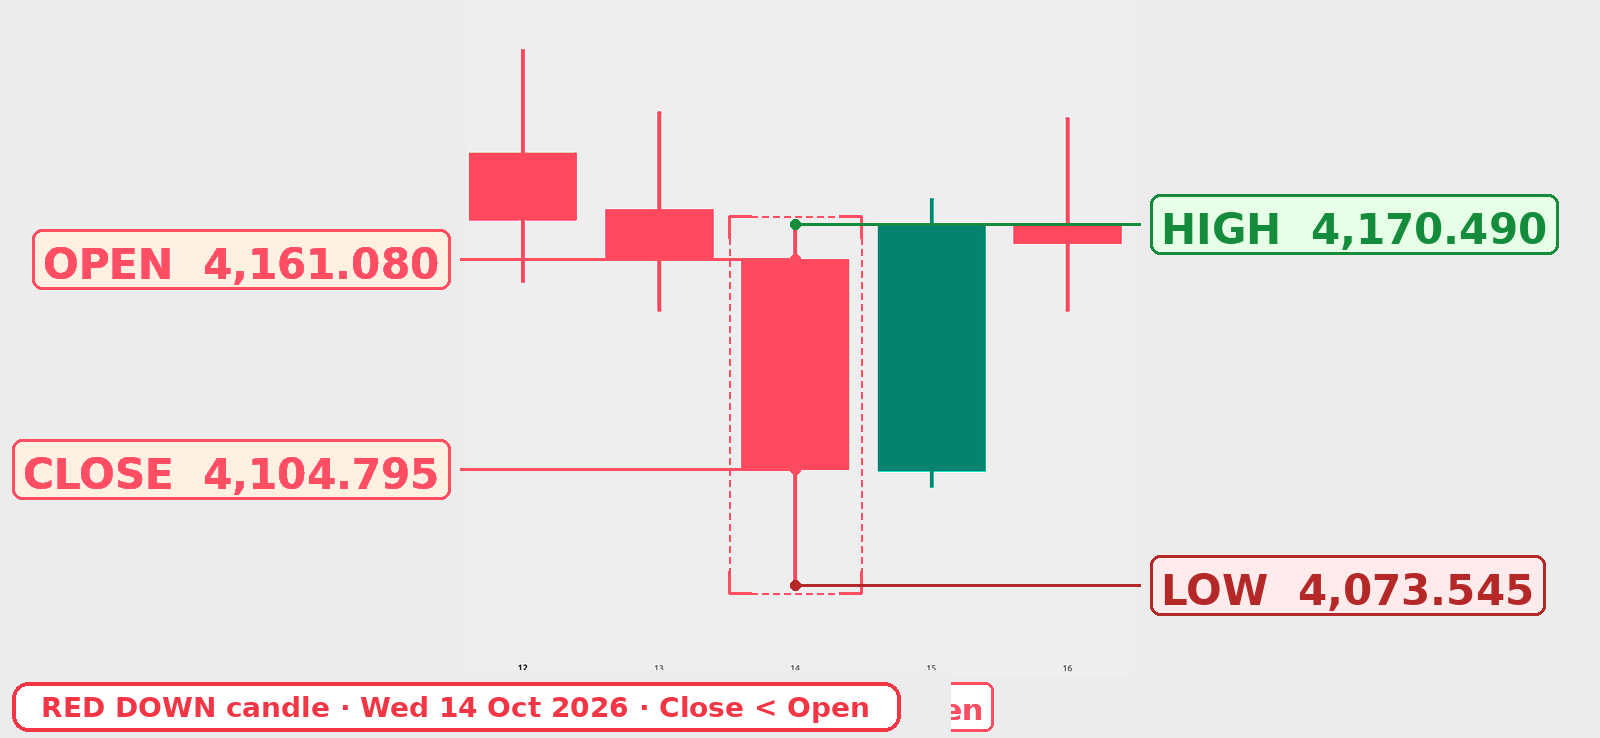
Step 3 — Red DOWN candle (asal chart)
- Wahi 1D chart pe Wed 14 Oct 2026 wali red candle pe hover karo
- Ab body ka upar = Open · body ka neeche = Close
- High aur Low phir bhi wick ke tips pe — yeh rule kabhi nahi badalta
Is candle ke numbers:
- Open 4,161.080
- High 4,170.490
- Low 4,073.545
- Close 4,104.795
Close < Open — is liye candle red (DOWN) hai.
Aam ghalti
Kai beginners sochte hain: “Open hamesha body ke neeche hota hai.”
Galat. Yeh sirf UP candle pe sahi hai.
DOWN candle pe Open body ke upar hota hai. High/Low hamesha tips pe rehte hain.
Step 4 — Legend se numbers padho
- Chart pe kisi bhi candle pe hover karo
- Upar-left status line mein
O … H … L … C …dikhega - Agar numbers nahi dikhte to: Chart Settings → Status line → Chart values ON karo
- Yeh wahi 4 prices hain jo candle pe baithe hain — bas likhayi mein
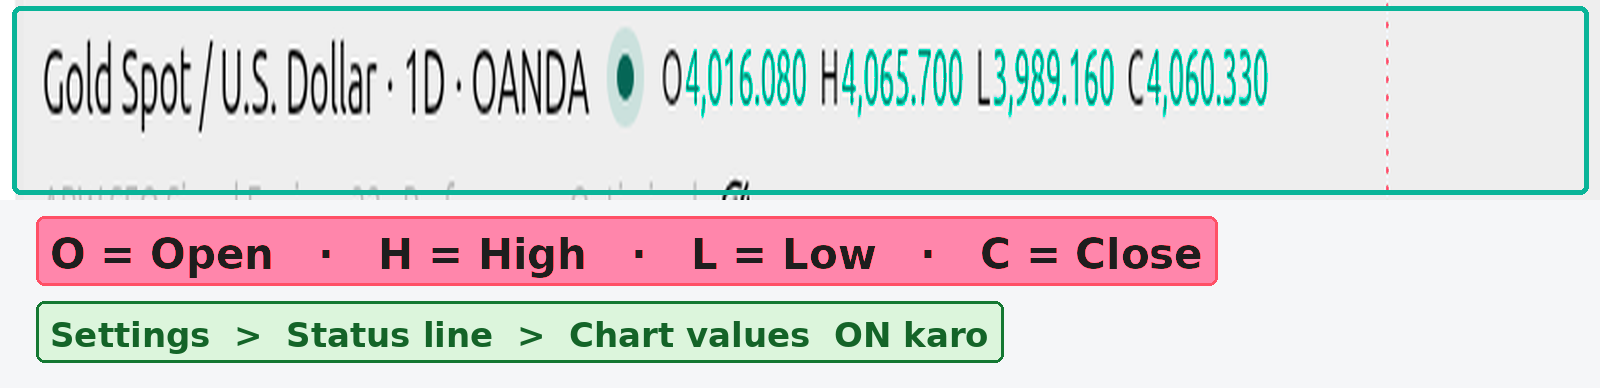
Legend = tez nazar. Exact copy-paste ke liye agla step behtar hai.
Step 5 — Data window (exact numbers)
- Chart ke right side pe Data window tab kholo (Object tree ke paas)
- Candle pe hover karo — date + Open / High / Low / Close list aa jati hai
- Yahan se numbers copy karna asaan hai — assignment ke liye yahi use karo
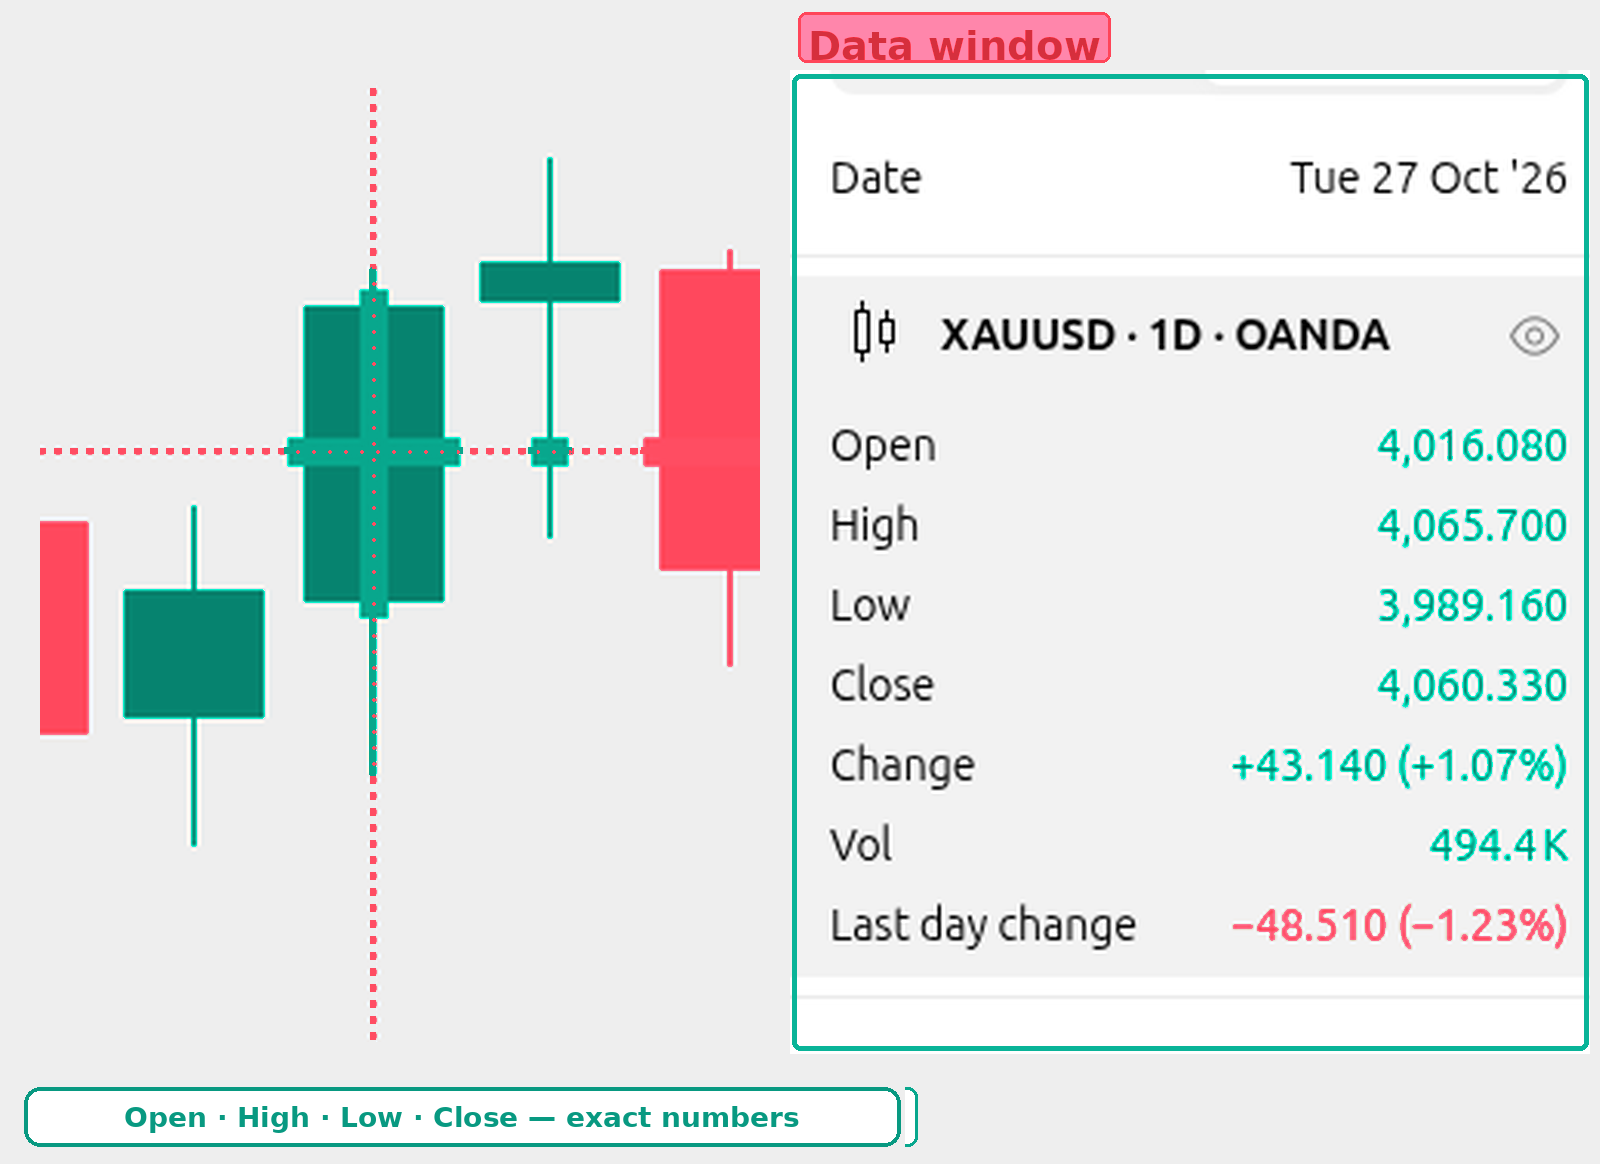
Do jagah, ek hi kahani: legend tez pehchan ke liye; Data window clear list ke liye.
Step 6 — Mini hisaab (candle size aur body)
- Wahi Tue 27 Oct green candle ke numbers lo
- Candle size = High − Low
4,065.700 − 3,989.160 = 76.54 - Body size = |Close − Open|
4,060.330 − 4,016.080 = 44.25 - Baqi height wicks ki hai (High se body tak + body se Low tak)
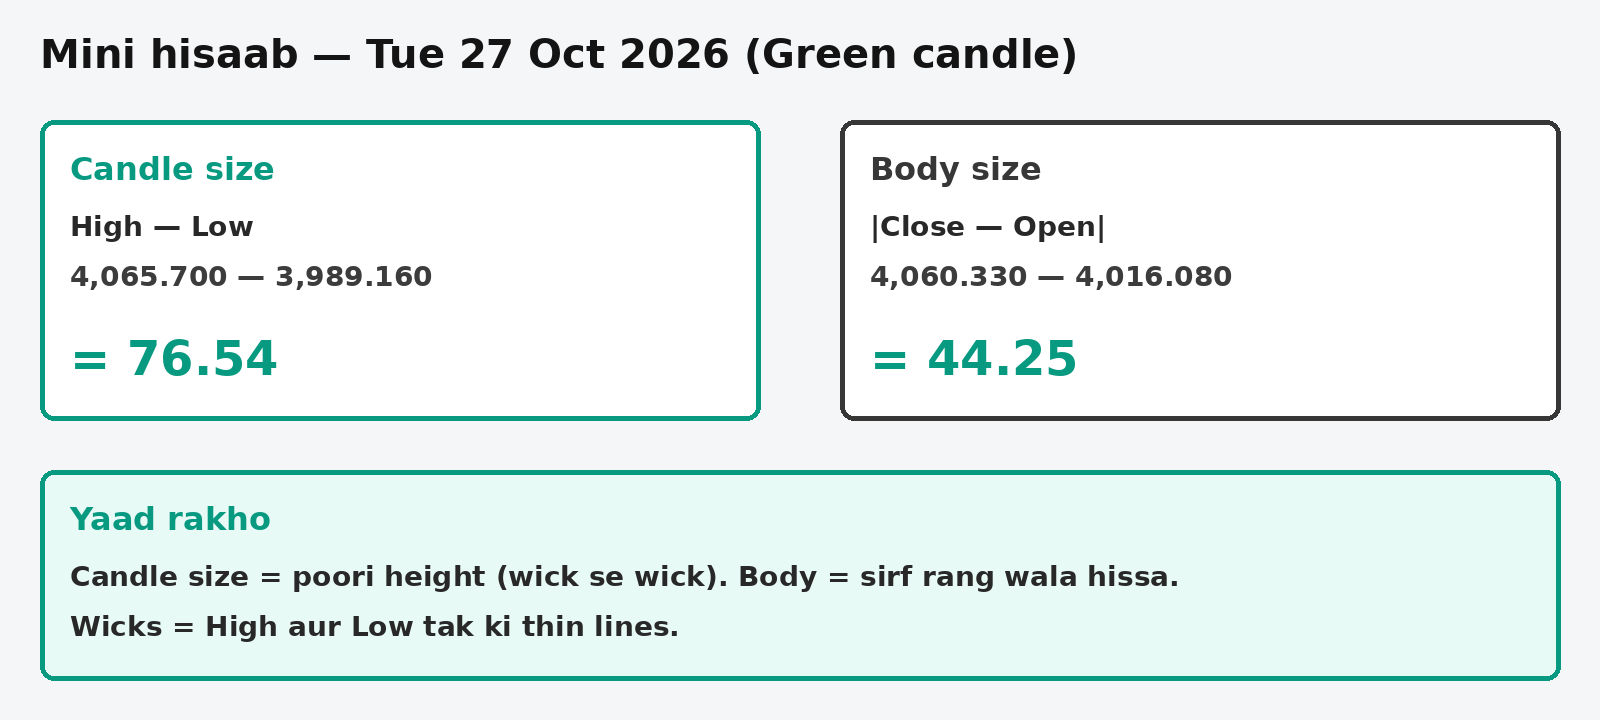
Badi wick = us taraf zyada rejection. Abhi sirf pehchan — strategy baad mein.
Step 7 — Badi candle ka OHLC = chhoti candles se
Lesson 4 Step 9 yaad hai? Green box = chhoti candles; right = badi candle.
Ab rule clear likh dete hain — 4 prices ka map:
- OPEN = pehli chhoti candle ka Open
- HIGH = box ke andar sab se uncha High
- LOW = box ke andar sab se neecha Low
- CLOSE = aakhri chhoti candle ka Close
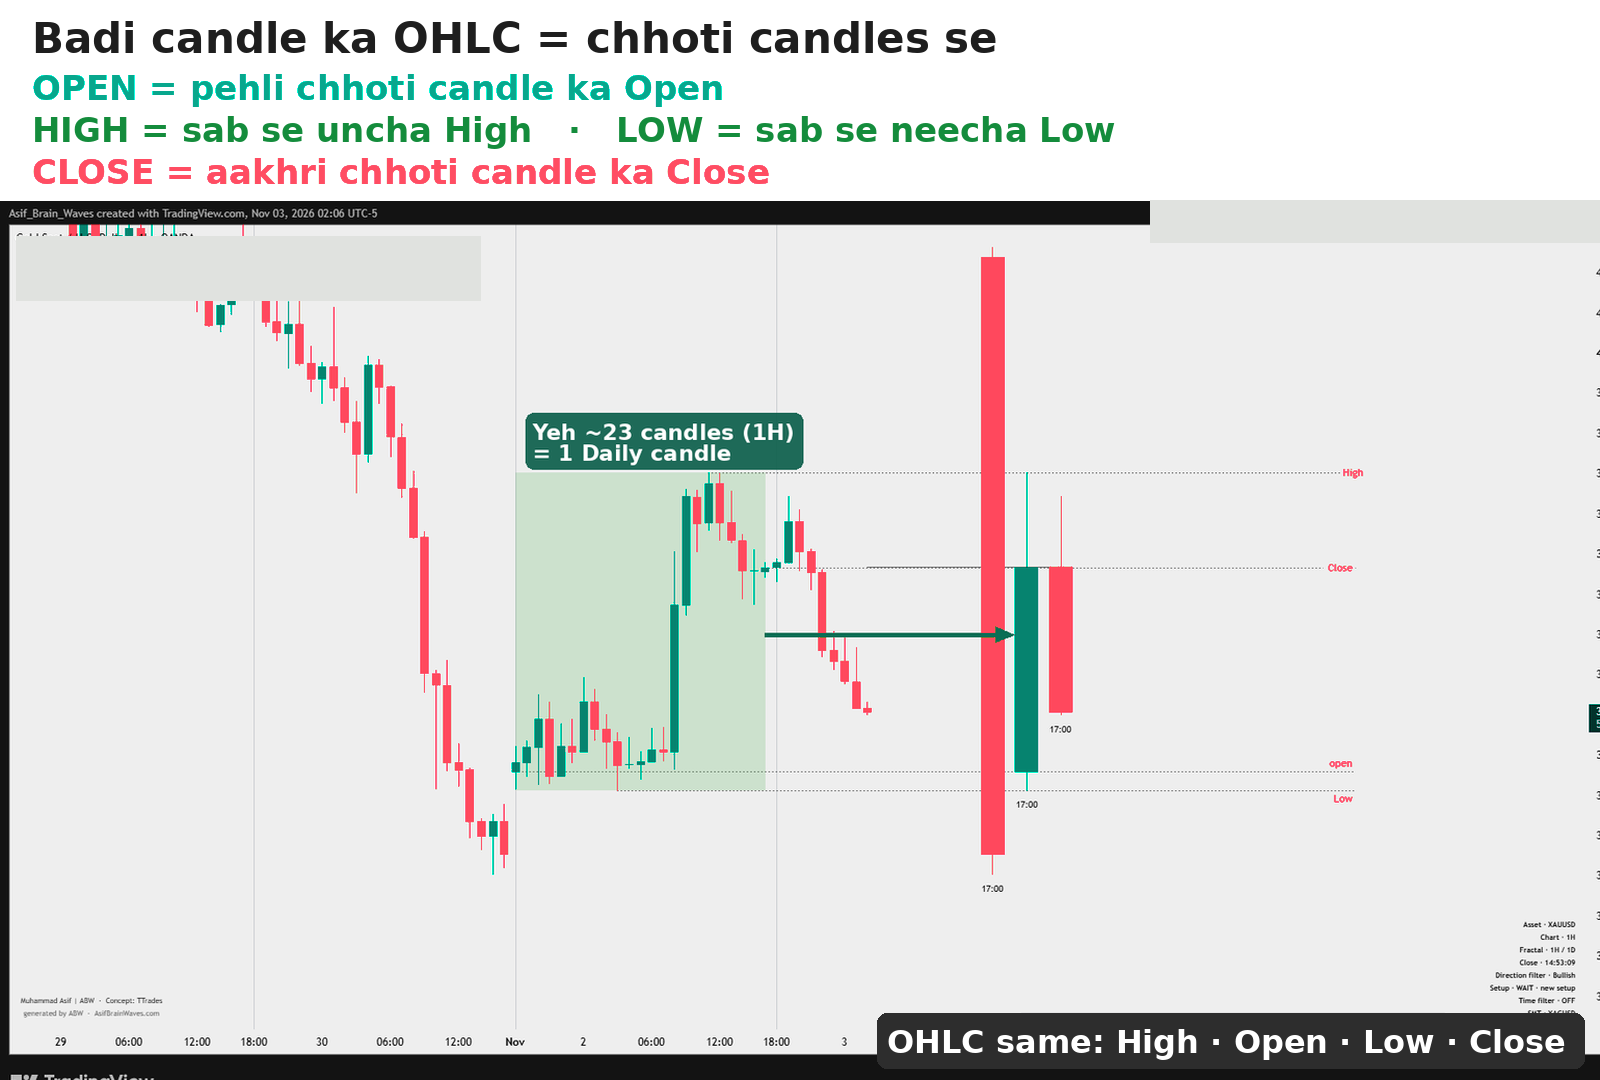
Isi liye Lesson 4 mein kaha tha: badi candle ek summary hai — andar chhoti candles ke 4 prices mil kar.
Yaad rakhne ka tareeqa
“H-O-L-C nahi — High aur Low hamesha tips; Open/Close body pe.”
High upar · Low neeche · Open/Close body pe — rang batata hai kaun upar.
- Green (UP): Close body ke upar, Open neeche
- Red (DOWN): Open body ke upar, Close neeche
- Pehle Close padho — yeh batata hai candle kis ne jeeti
- Phir High aur Low — poori height (candle size)
- Numbers ke liye Data window use karo; tez nazar ke liye legend
- Badi timeframe pe OHLC pehle — phir chhoti pe same 4 prices toot kar dekho
- Screenshot mein hamesha XAUUSD + timeframe + date clear ho
Strategy, buy/sell signals — abhi nahi. Pehle map clear.
- Diagram pe green aur red candle ke 4 points pehchan liye
- Asal green candle pe Open / High / Low / Close labels match kiye
- Red candle pe dekha: Open body ke upar hai
- Legend mein Chart values ON karke O H L C padh liye
- Data window se exact numbers copy kar liye
- Candle size = High − Low aur body = |Close − Open| try kiya
- Rule yaad: badi candle Open = pehli chhoti Open; Close = aakhri chhoti Close
Task (ghar ka kaam)
Upload 1 screenshot:
- TradingView pe XAUUSD kholo, timeframe 1D
- Kal (yesterday) ki candle choose karo
- Data window se uske O, H, L, C likh lo (paper ya phone note)
- Chart pe High aur Low pe horizontal lines lagao
- Screenshot mein dikhe: XAUUSD, 1D, dono lines, aur agar mumkin ho to Data window
- File: PNG ya JPG, 8MB se kam
- Course form pe upload karo
Bonus (optional): note mein candle size (High − Low) bhi likh do.
Educational only — no profit promises.