
- Left drawing panel kahan hai aur lines menu kaise kholte hain
- Horizontal line, trend line, rectangle box aur text label lagana
- Edit toolbar se color, thickness, lock aur ek drawing delete
- Magnet mode aur trash menu — kab safe, kab khatra (Remove drawings)
Level: Bilkul aaghaz · Asset: Gold (XAUUSD) 1D · Time: ~15–18 min
Left drawing panel kya hai?
Lesson 2 mein left tools skip kiye the. Ab unse chart par marking seekhenge. Sirf Gold (XAUUSD) 1D. Trade nahi — sirf lines aur box.
Step 1 — Left panel pehchano
- Chart ke bilkul left pe vertical tools ki strip dekho
- Cyan box (1) = yahi left drawing panel hai
- Upar lines / trend icons, neeche text, magnet, trash
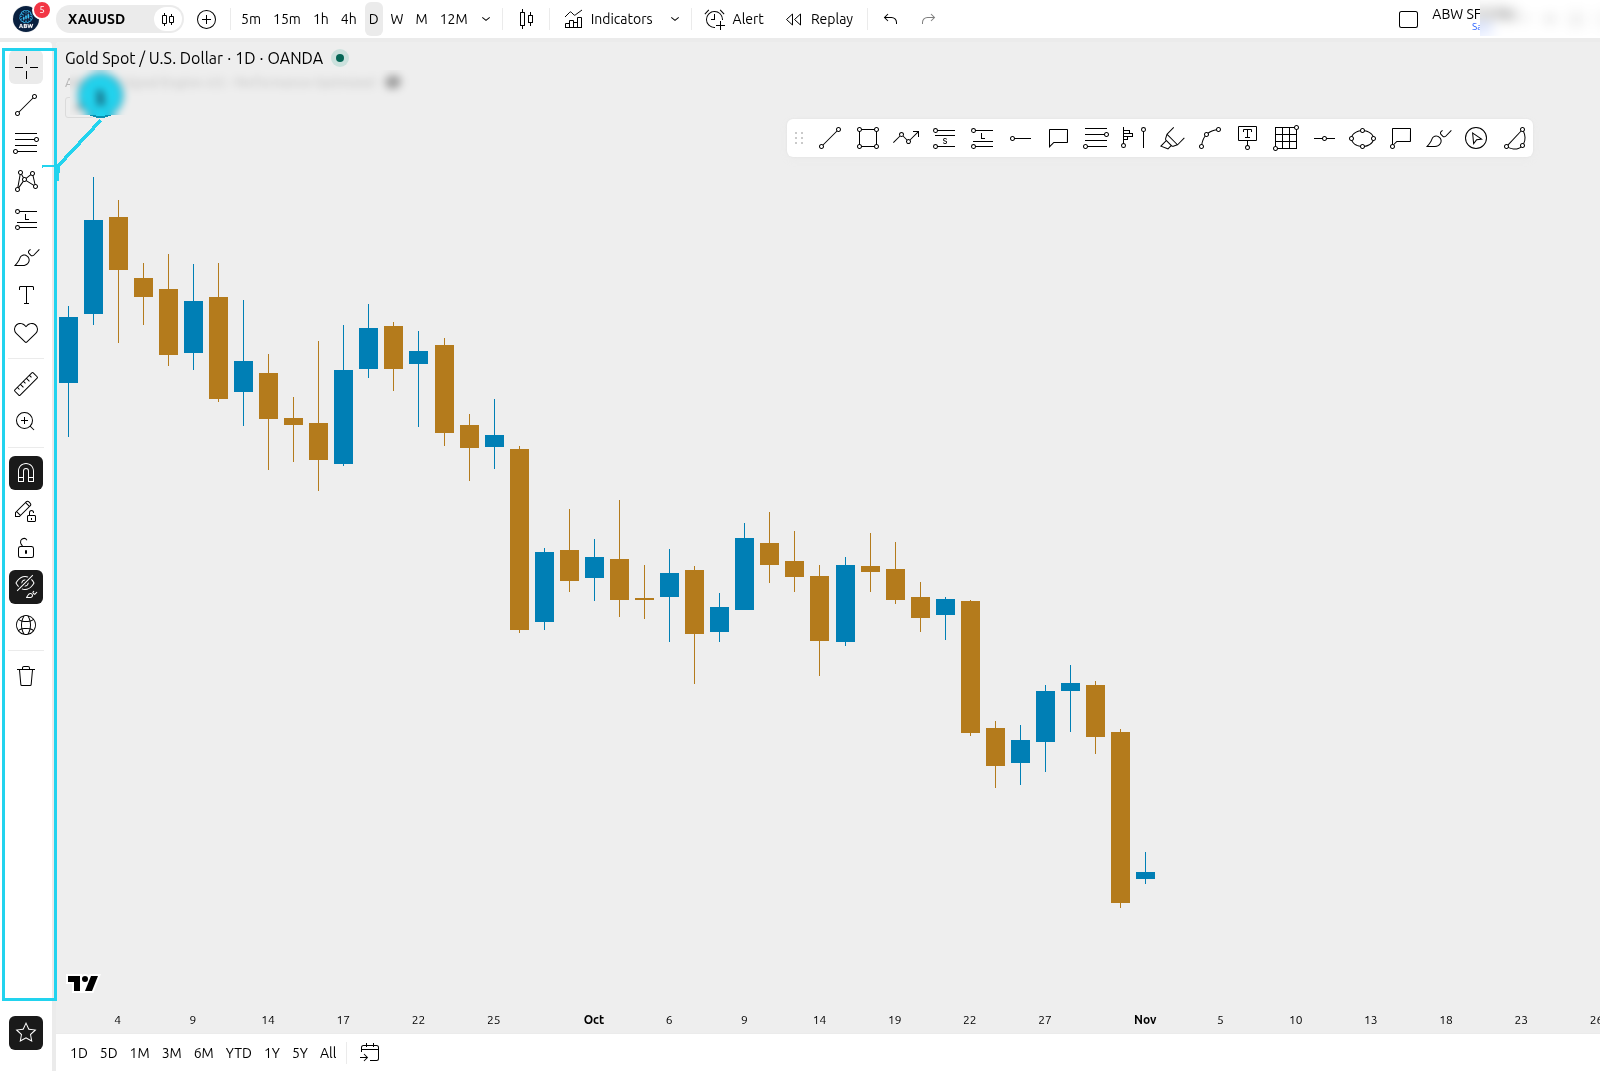
Yahi se saari marking shuru hoti hai.
Step 2 — Lines menu kholo
- Left panel pe Trend Line wala icon dabao (ya uske neeche arrow)
- Menu khulti hai — lines ki list
- Circle 1 = Trend Line · Circle 2 = Horizontal Line
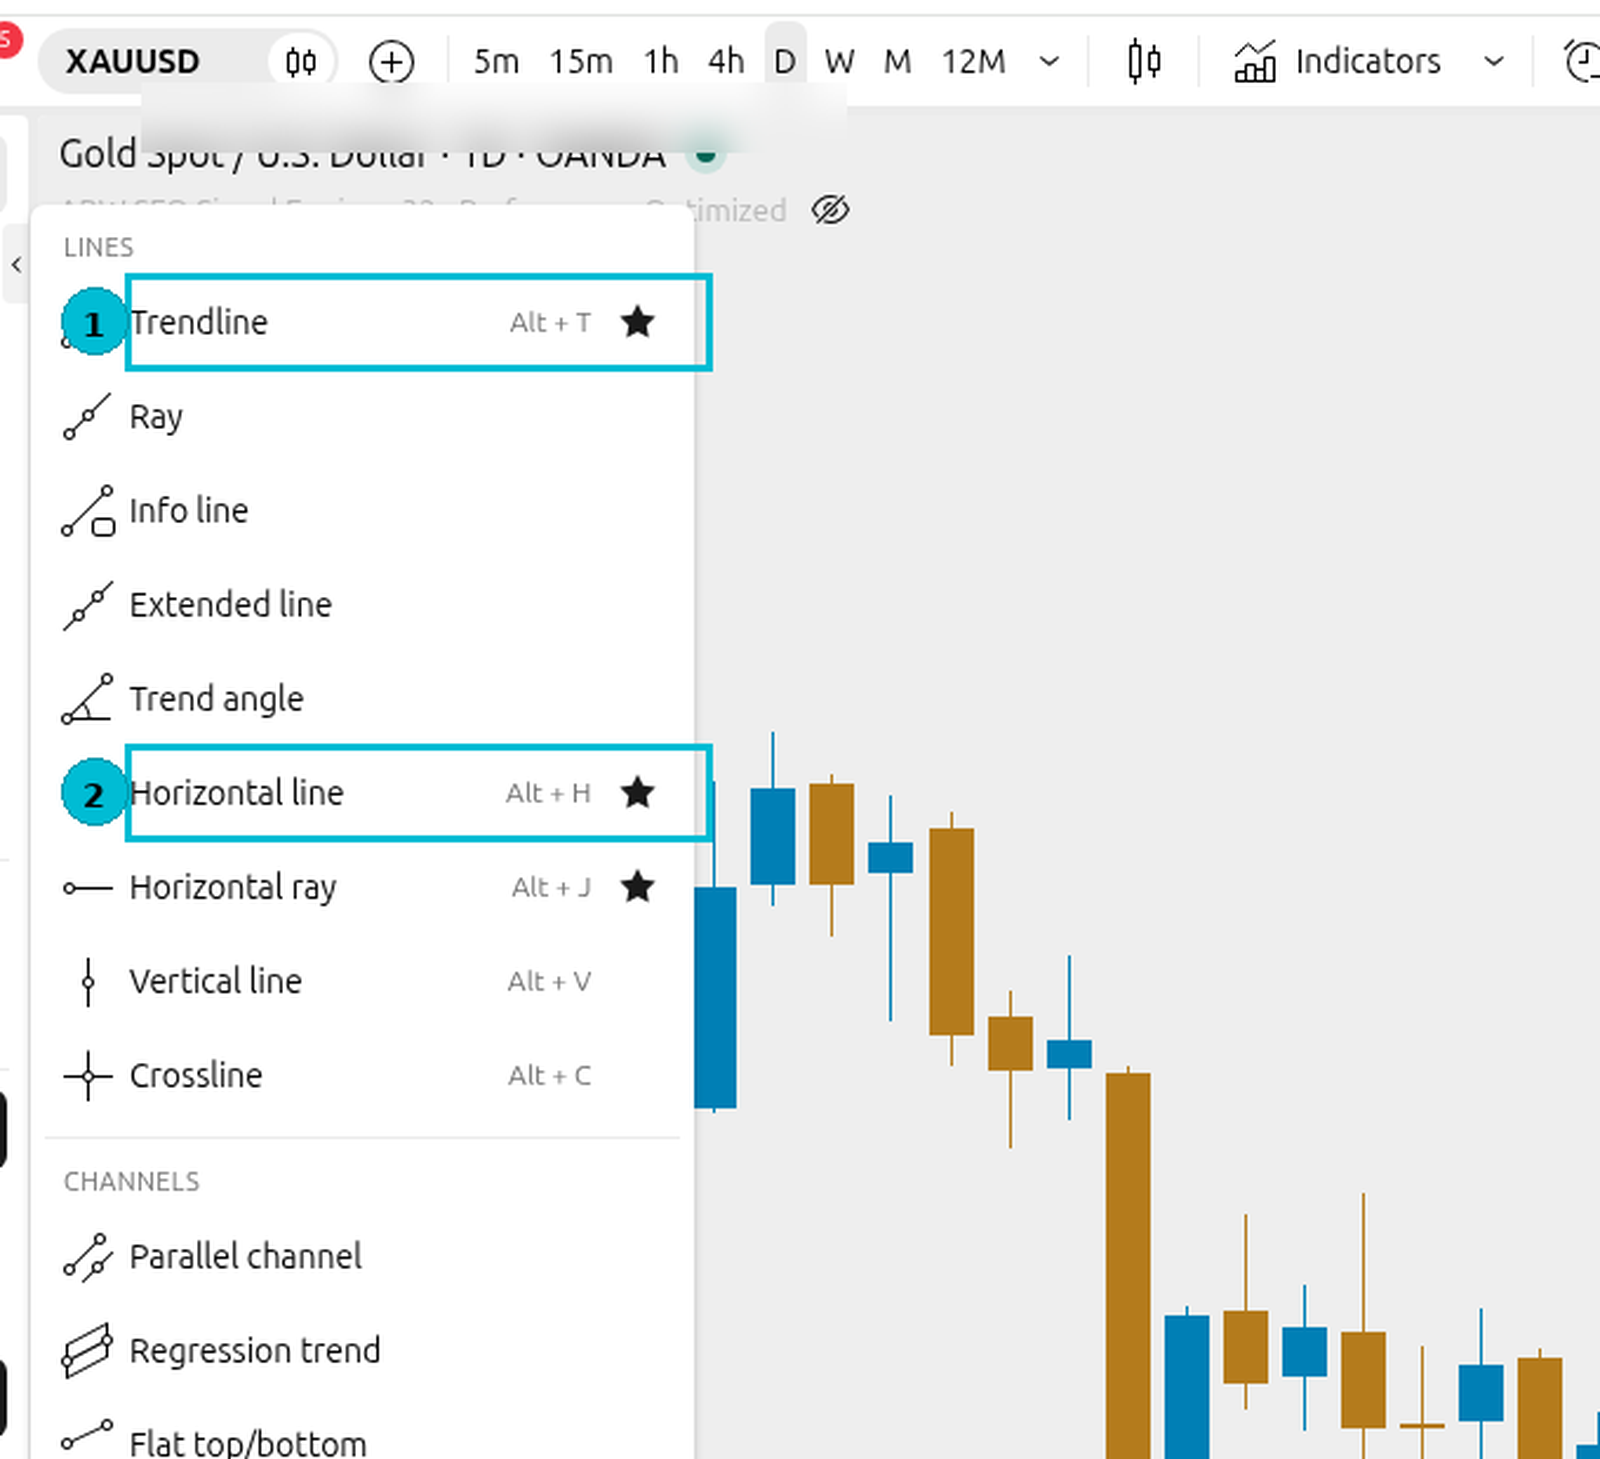
Pehle Horizontal Line seekhte hain.
Step 3 — Horizontal line (swing high)
- Lines menu se Horizontal Line choose karo
- Chart pe ek swing high (upar wali peak) pe click karo
- Seedhi horizontal line poori width pe lag jayegi
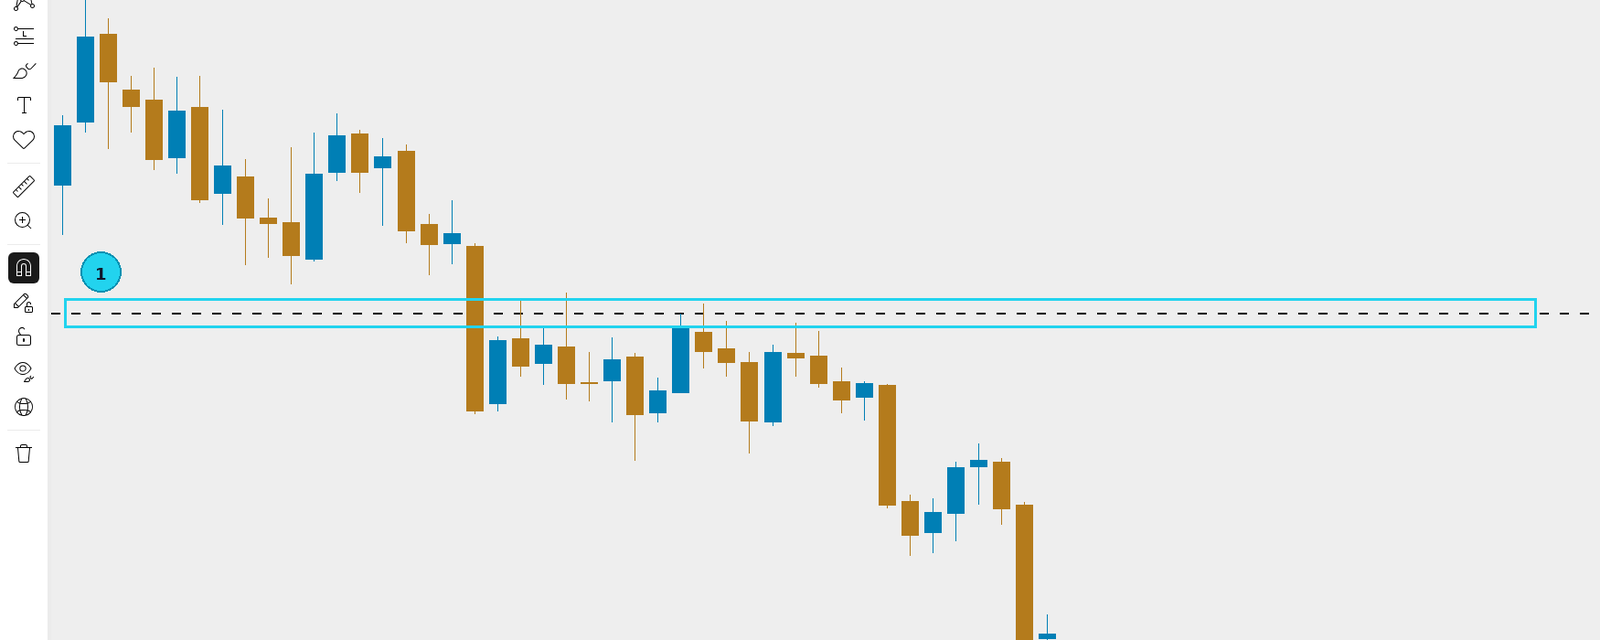
Yeh line price level dikhati hai — upar / neeche clear.
Step 4 — Trend line (do swing highs)
- Lines menu se Trend Line choose karo
- Pehli click = pehla swing high
- Doosri click = doosra swing high
- Line dono peaks join karti hai
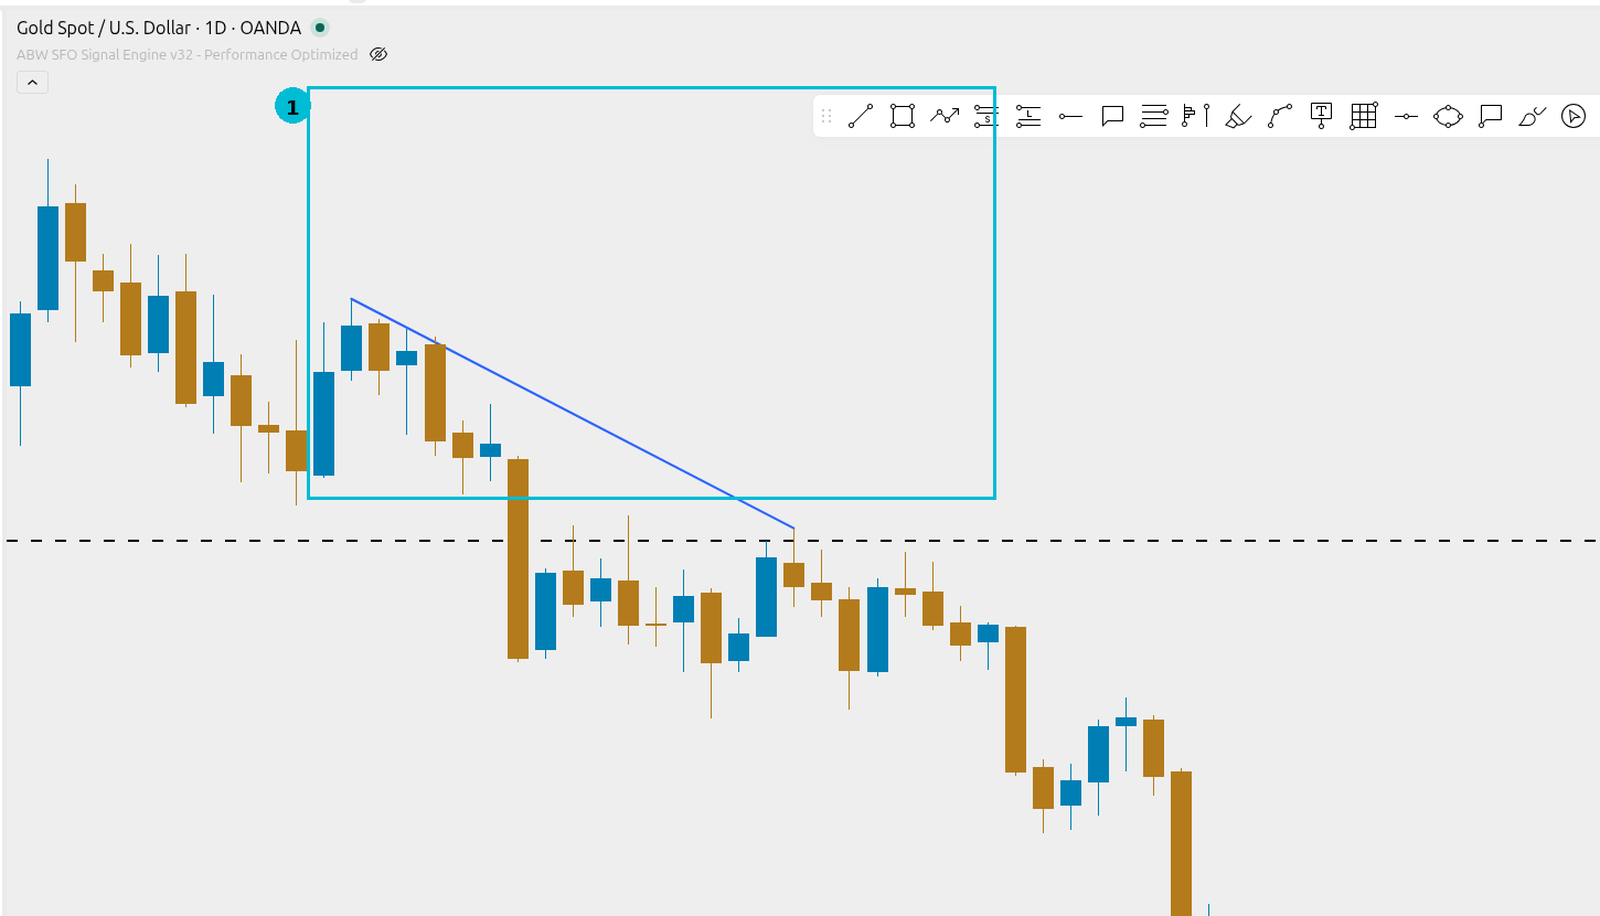
Trend line direction dikhati hai — seedhi horizontal nahi.
Step 5 — Rectangle box
- Left panel pe Rectangle / box tool choose karo
- Ek corner pe click-drag, doosri corner pe chor do
- Box kisi price zone ko highlight karta hai
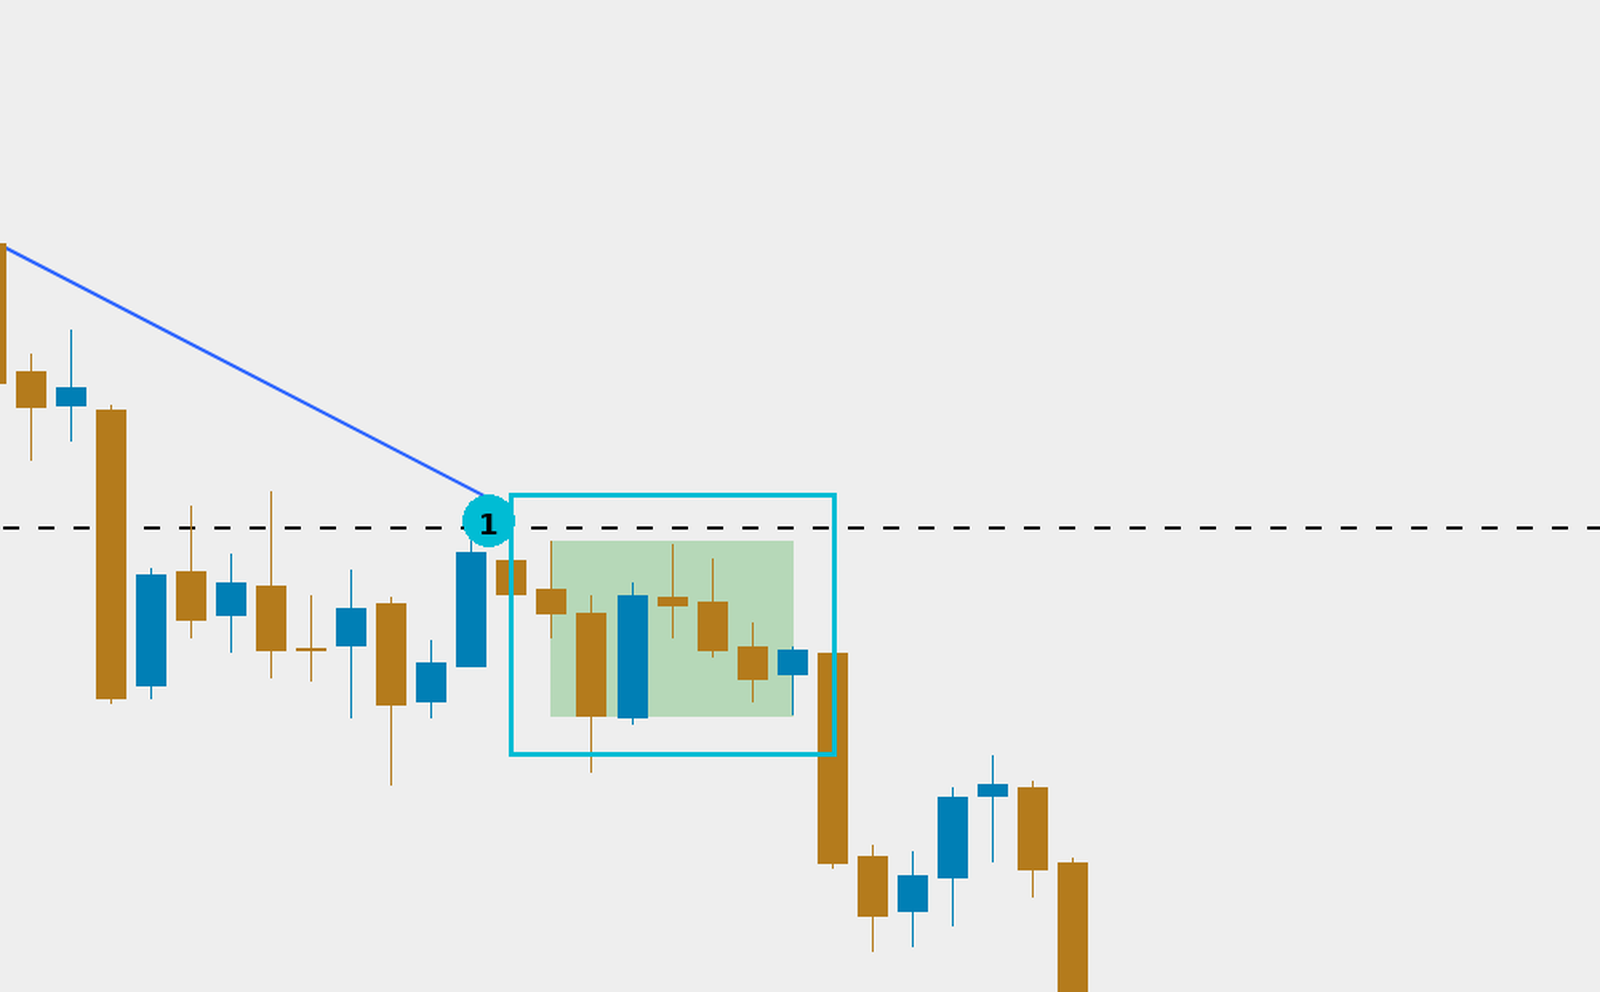
Box = area. Line = ek level.
Step 6 — Text label “High”
- Left panel pe Text (T) tool choose karo
- Swing high ke paas click karo
- Likho:
High - Enter / apply
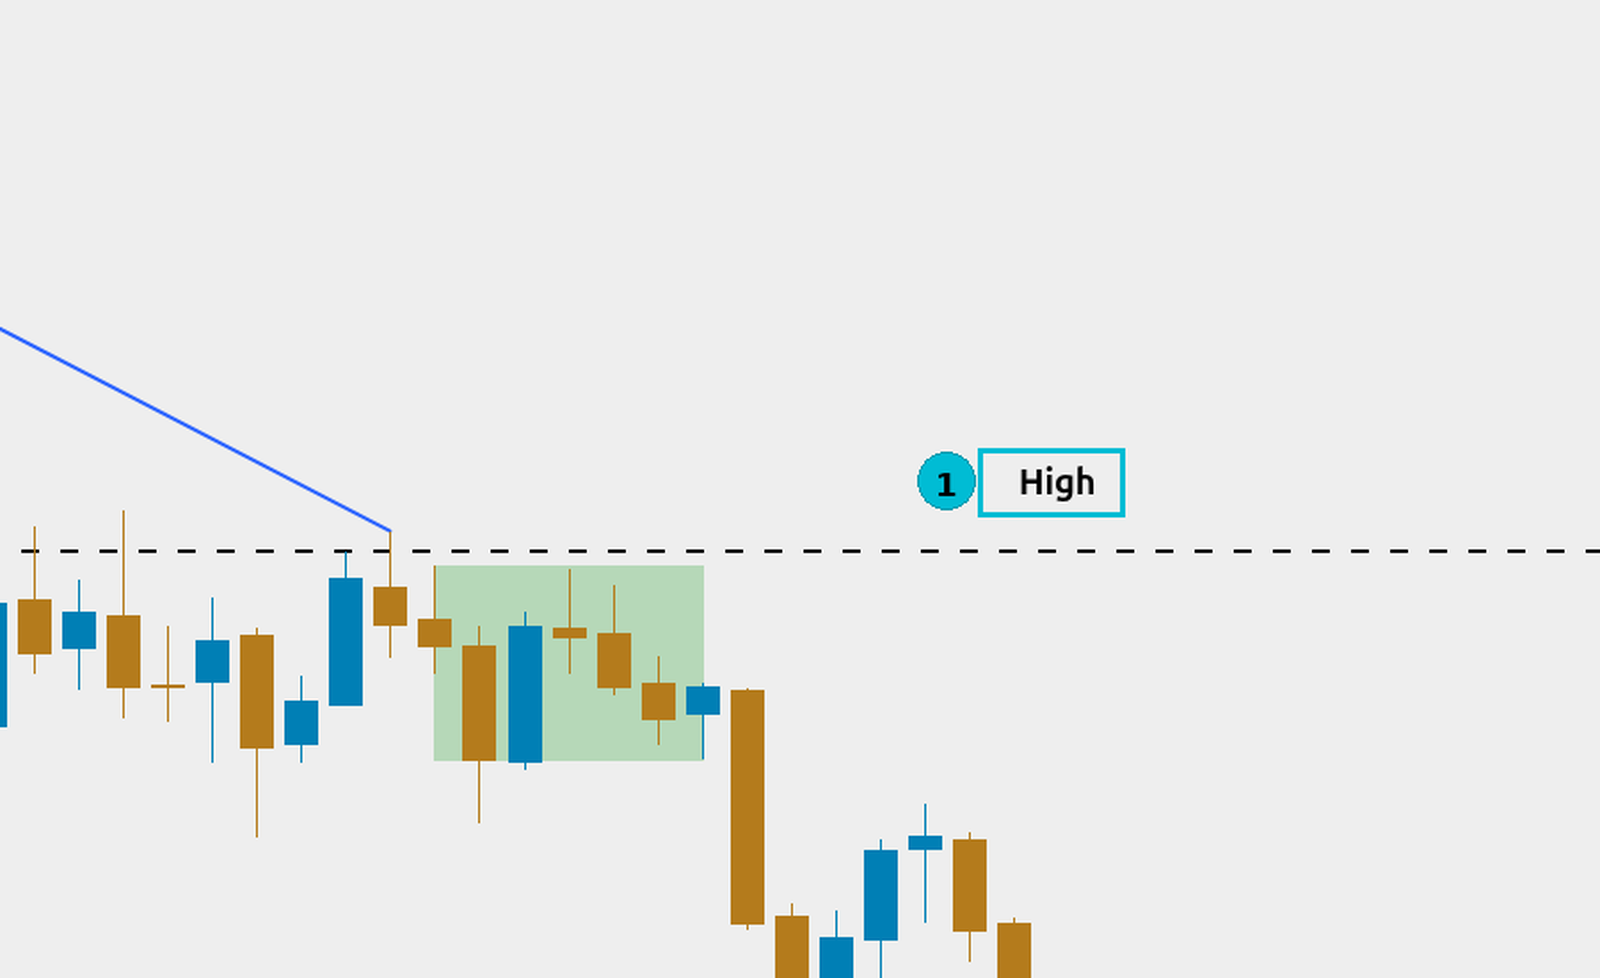
Label se yaad rehti hai — kaunsa peak important tha.
Step 7 — Edit toolbar
- Koi drawing select karo (line / box pe click)
- Upar floating toolbar aati hai
- Yahan se: color, thickness, lock, aur delete (sirf yeh ek drawing)
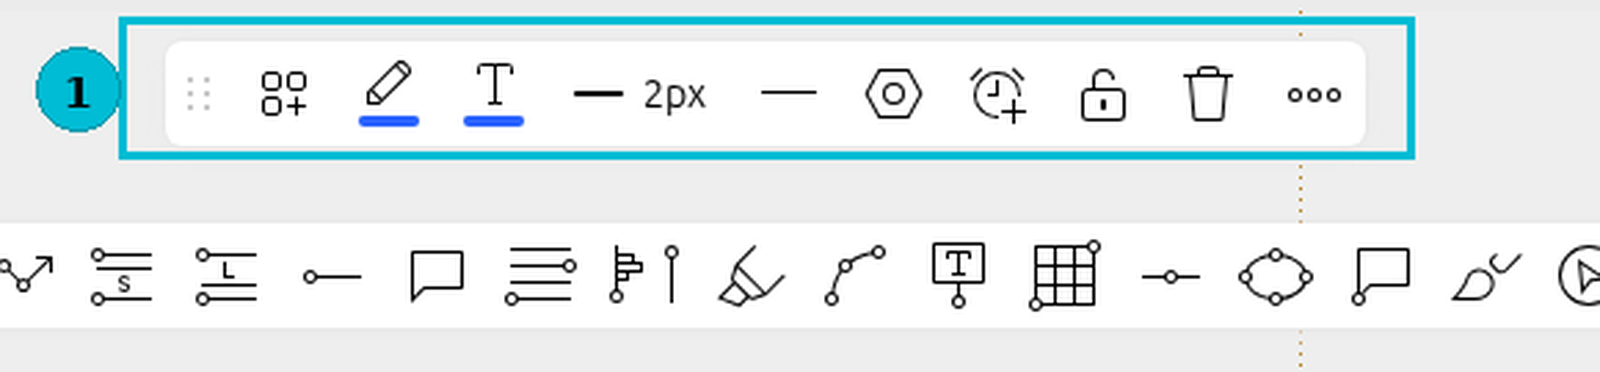
Delete yahan = sirf selected drawing. Poori chart safe.
Step 8 — Magnet mode aur trash (khatare wali warning)
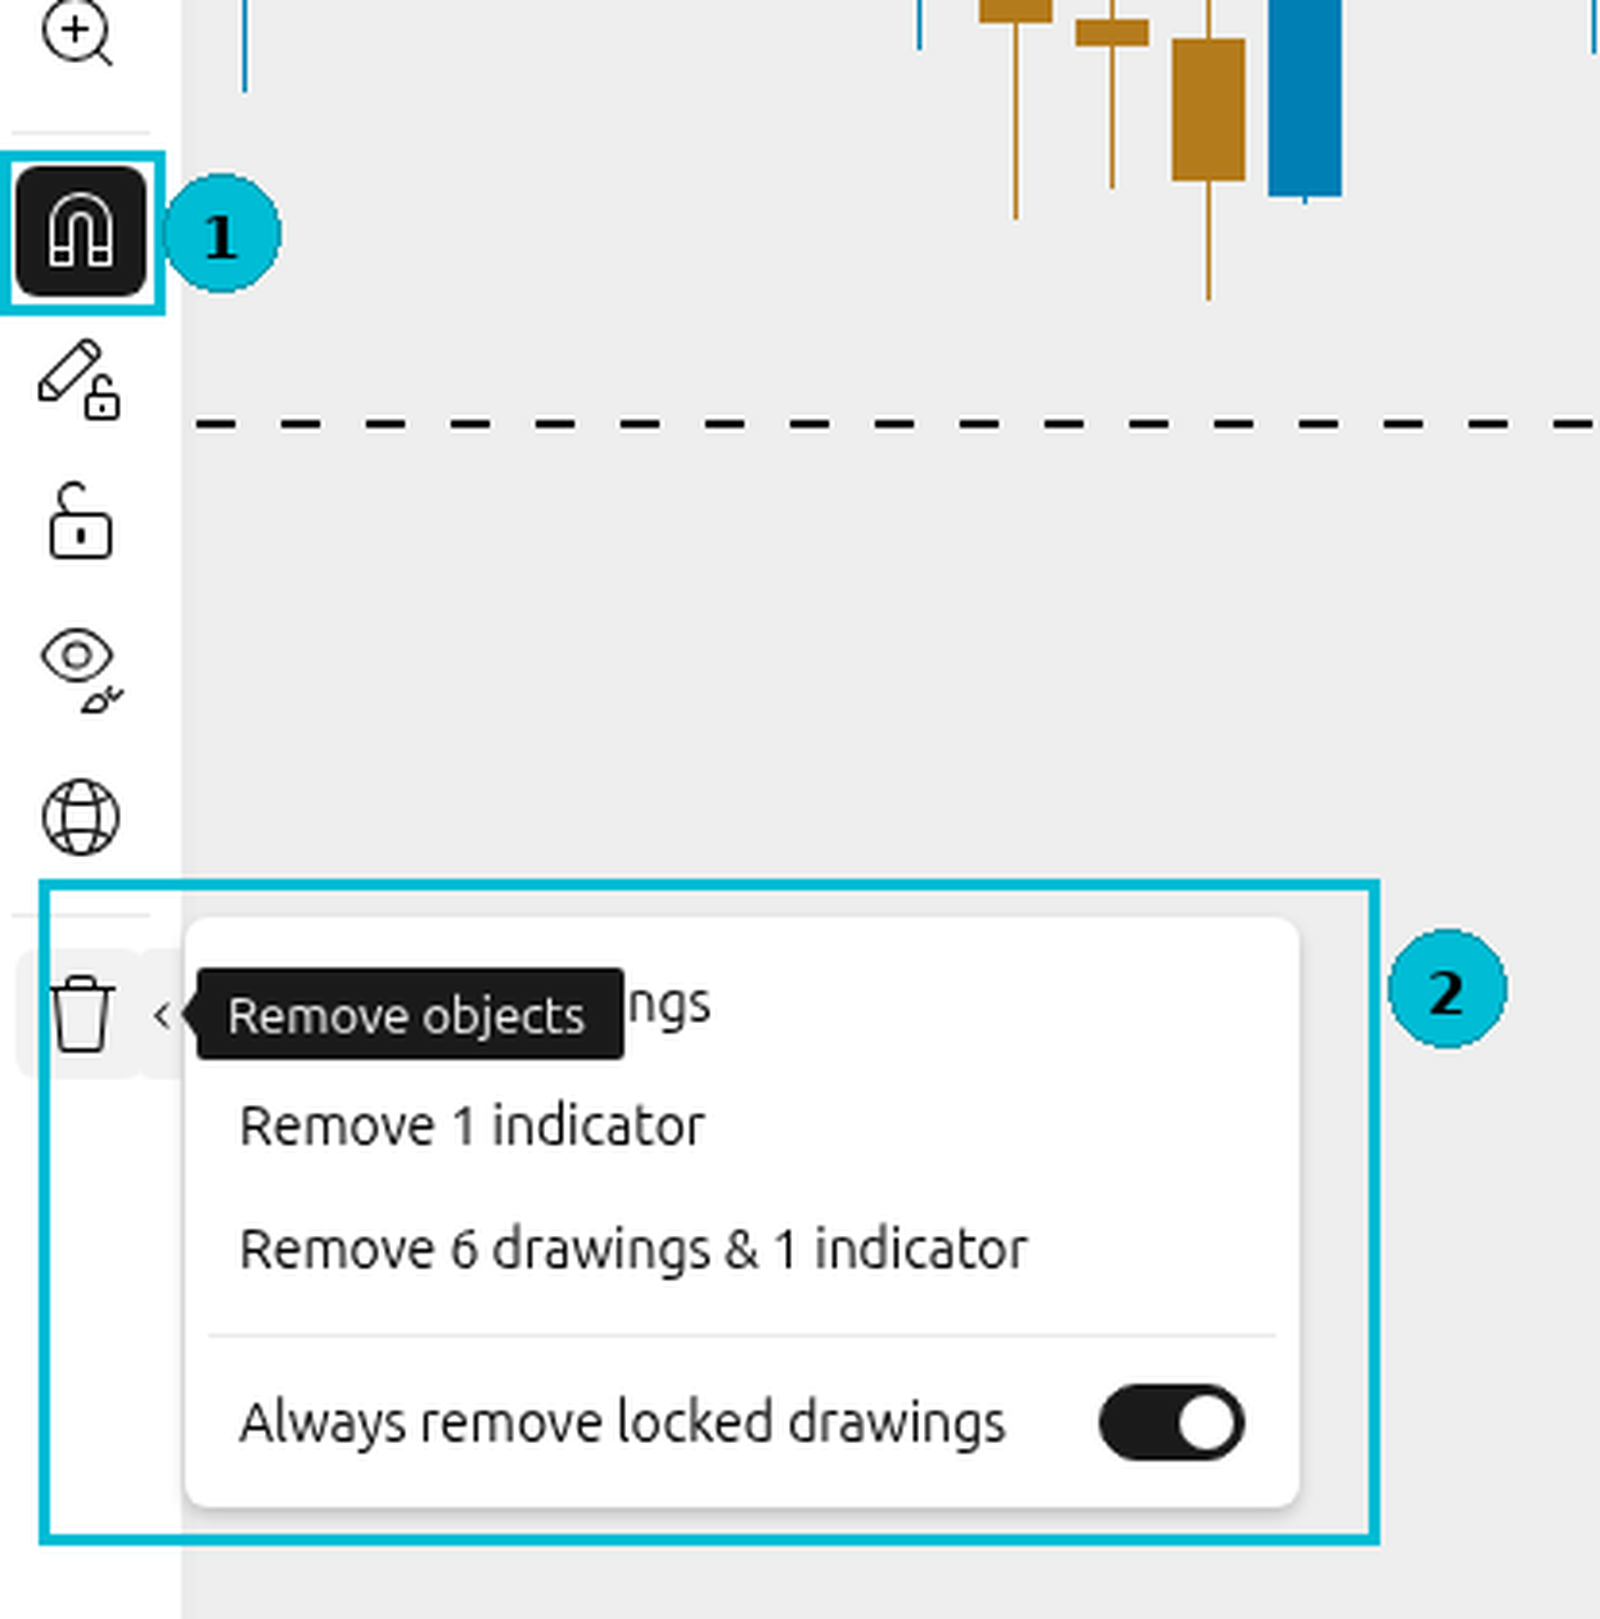
- Circle 1 = Magnet — ON karo to line candle high/low pe chipak jati hai
- Circle 2 = Trash menu
- Menu mein “Remove drawings” dikhega
Khatra: Remove drawings pe kabhi mat dabao — yeh saari drawings mita deta hai. Sirf ek drawing hatani ho to Step 7 ki delete use karo.
Step 9 — Final marked chart
Ab chart pe yeh hona chahiye:
- 1 horizontal line (swing high)
- 1 trend line (do highs)
- 1 rectangle box
- 1 text “High”
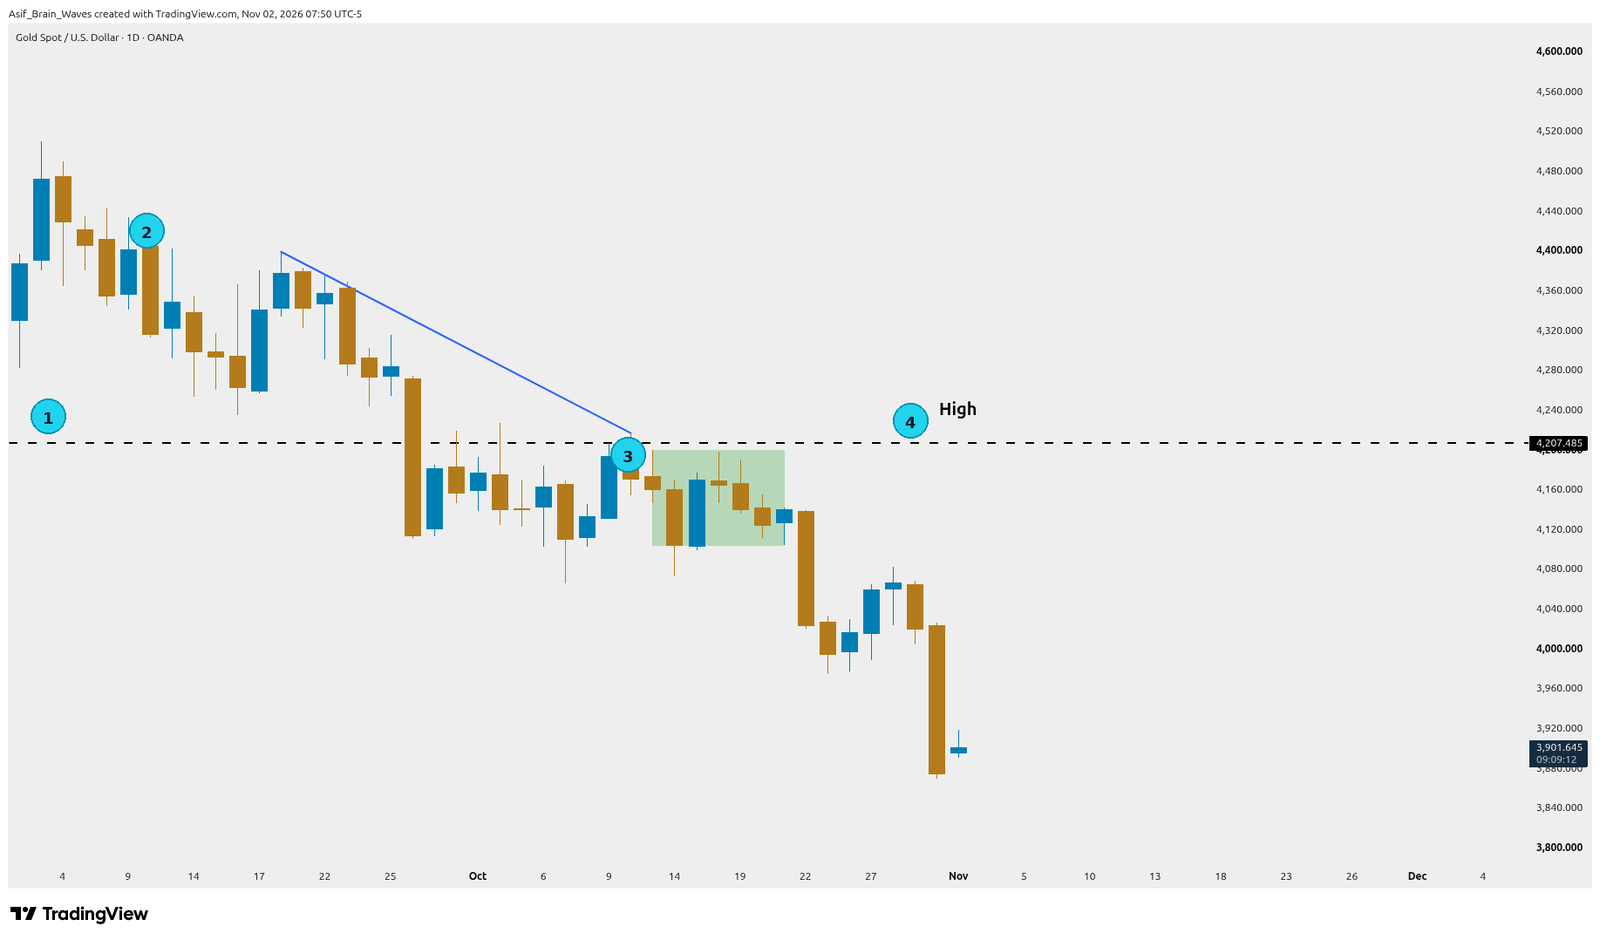
Yahi aap ka practice target hai.
- Pehle Magnet ON karo — line candle pe accurately lagegi
- Drawing select karke color / thickness set karo — screen clear rahe
- Galati ho to ek drawing delete (toolbar) — trash se Remove drawings kabhi nahi
- Beginners: sirf 3–4 marks — chart bhar mat do
- Screenshot mein XAUUSD + 1D dikhe
- Left drawing panel mil gaya
- Lines menu se Horizontal Line lagayi
- Do swing highs pe Trend Line join ki
- Ek Rectangle box lagaya
- Text “High” likha
- Edit toolbar se color / delete try kiya
- Magnet ON kiya
- Trash mein Remove drawings nahi dabaya
Task (ghar ka kaam)
Upload yeh screenshot:
- TradingView pe XAUUSD kholo, timeframe 1D, Candles
- 1 horizontal line — kisi swing high pe
- 1 trend line — do swing highs join
- 1 rectangle box — kisi price zone pe
- 1 text label — likho
High - Screenshot mein yeh 4 marks clear hon + upar XAUUSD / 1D dikhe
- File: PNG ya JPG, size 8MB se kam
- Course form pe upload karo
Educational only — no profit promises.