
- Timeframe kya hota hai — har candle kitna time dikhati hai
- Top menu se timeframe kaise badalte hain (M, W, 1D, 4H, 1H, 5m)
- Ek badi candle ke andar kitni chhoti candles aati hain
- Pehle badi timeframe kyun dekhte hain (top-down)
Level: Bilkul aaghaz · Asset: Gold (XAUUSD) · Time: ~18–22 min
Timeframe kya hai?
Timeframe = har candle kitna time cover karti hai.
Monthly pe 1 candle = 1 mahina.
5 minute pe 1 candle = sirf 5 minute.
Wahi Gold (XAUUSD) — alag timeframe pe bilkul alag picture.
Step 1 — Timeframe menu kholo
- Chart ke bilkul upar, symbol (XAUUSD) ke baad timeframe button dekho (jaise
1Dya5m) - Us pe click karo — list khulti hai: Minutes, Hours, Days
- Yahi se M, W, 1D, 4H, 1H, 5m choose karte hain
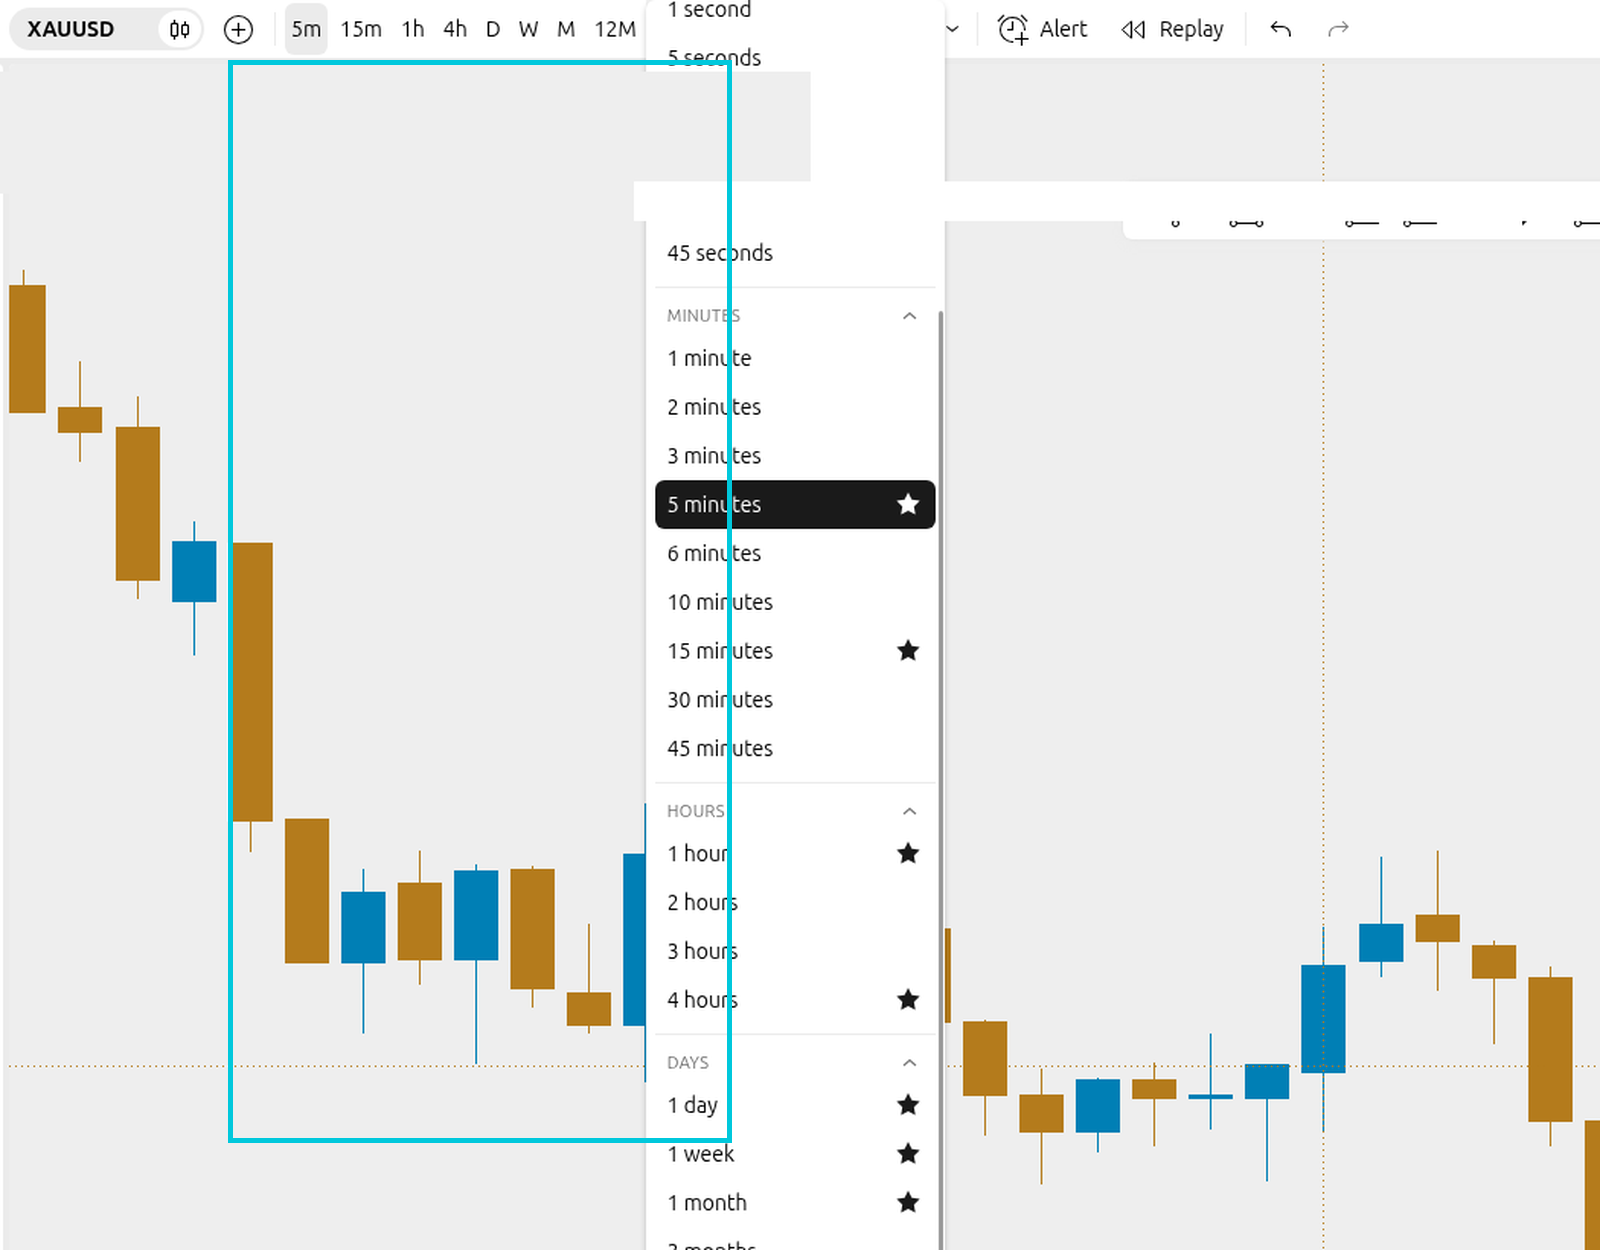
Pehle menu pehchano, phir ek-ek timeframe try karo.
Step 2 — Monthly (M)
- Menu se 1 month / M choose karo
- Ab har candle = 1 mahina
- Saal ka bada trend clear dikhta hai — candles kam, picture bari
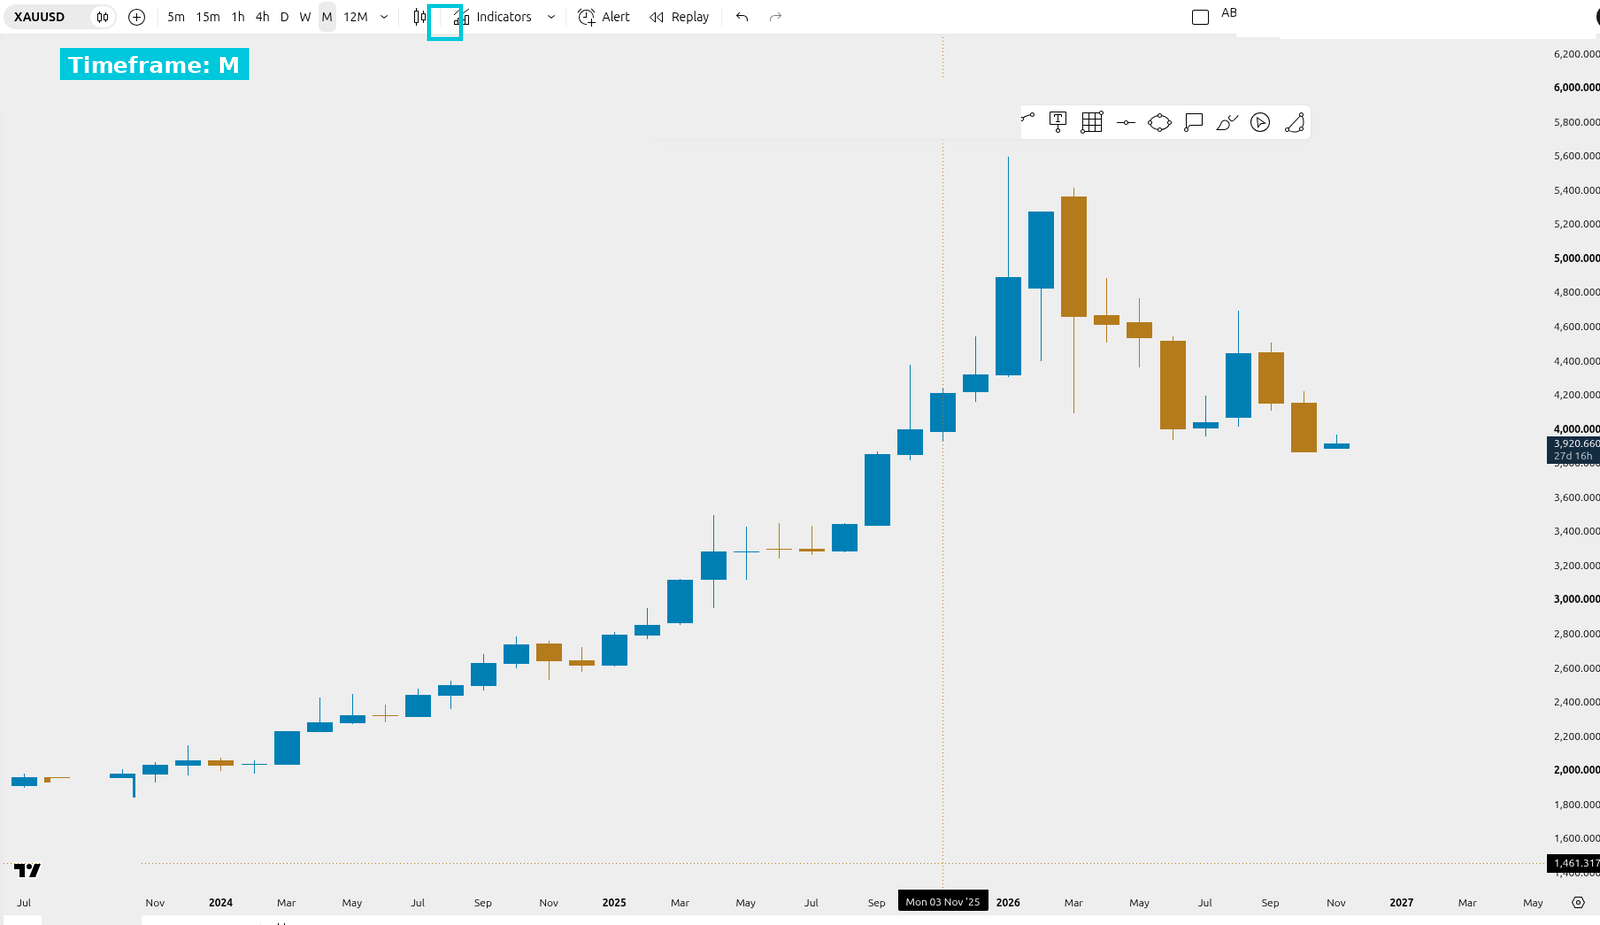
Monthly = sab se bari box. Detail kam, direction zyada clear.
Step 3 — Weekly (W)
- Menu se 1 week / W choose karo
- Har candle = 1 hafta
- Monthly se thodi zyada detail — phir bhi bari picture
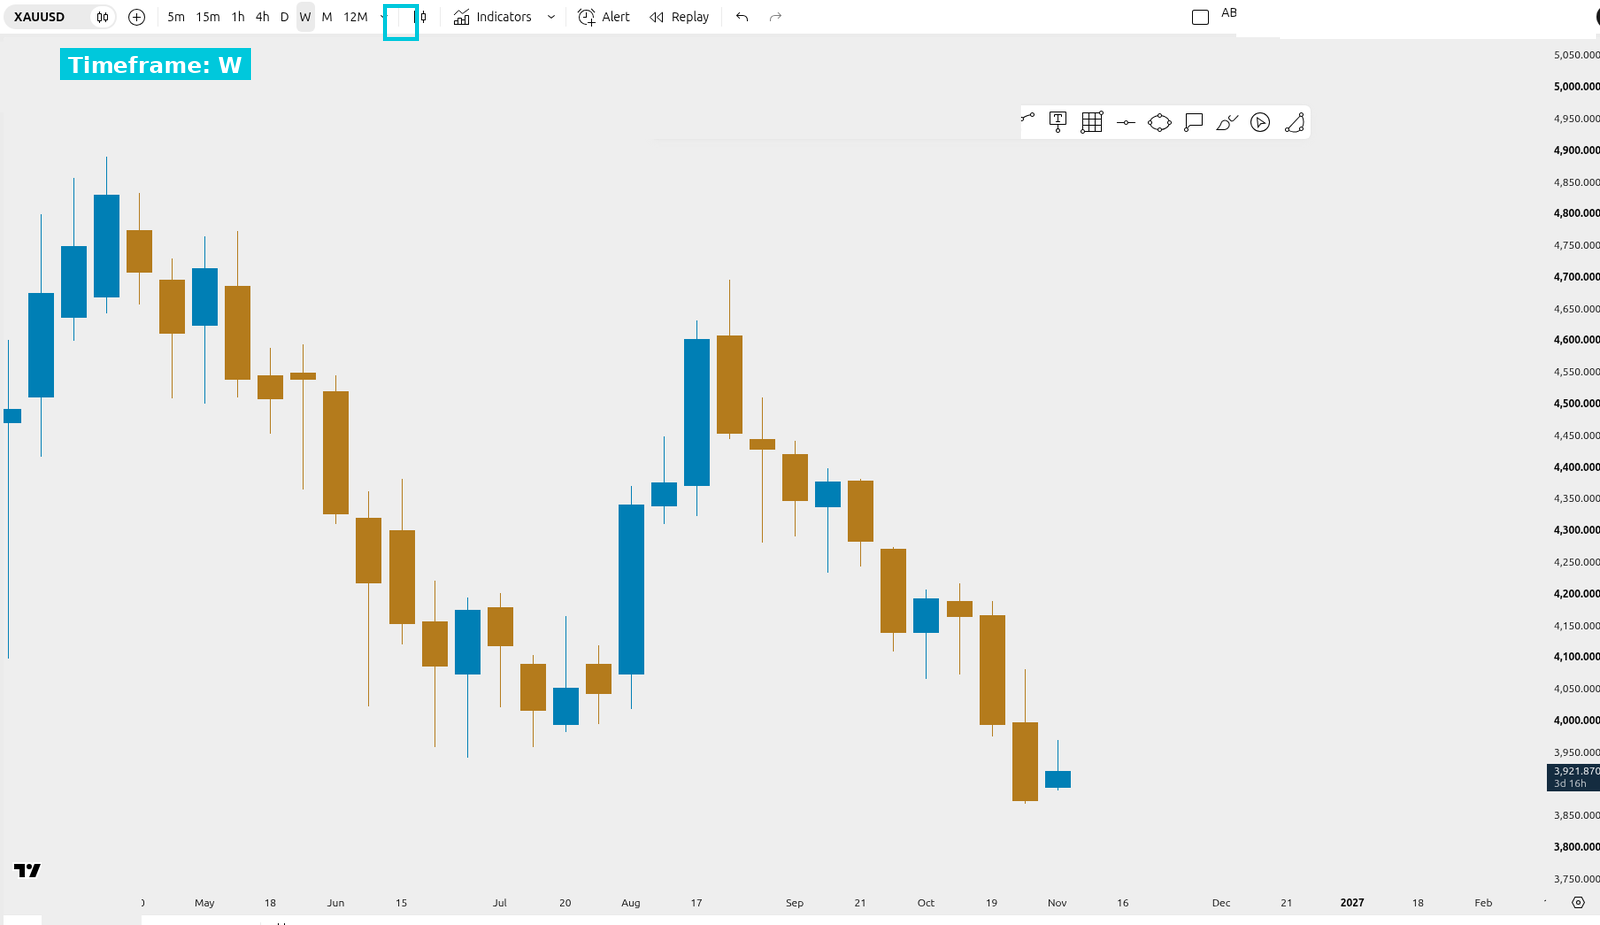
Weekly pe swings Monthly se chhote, lekin abhi bhi calm.
Step 4 — Daily (1D)
- Menu se 1 day / D choose karo
- Har candle = 1 trading din
- Yeh wahi Gold chart hai jo Lesson 3 mein mark kiya tha
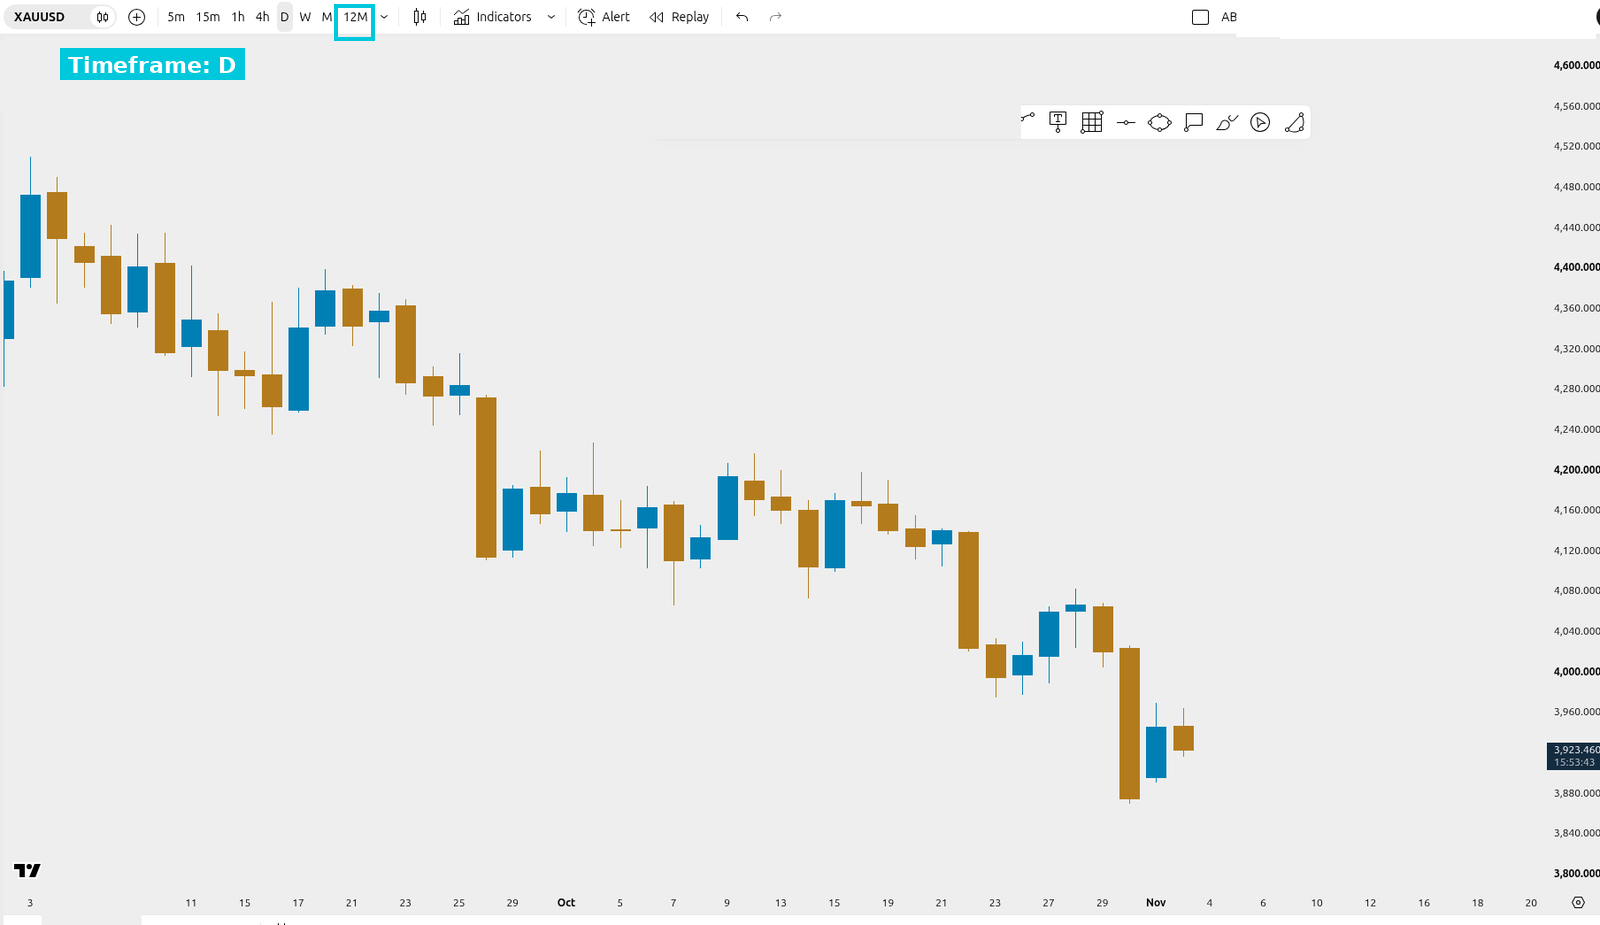
1D beginners ke liye sweet spot — na itni bari, na itni shor.
Step 5 — 4 Hour (4H)
- Menu se 4 hours / 4h choose karo
- Har candle = 4 ghante
- 1D se zyada candles — moves andar se dikhne lagtay hain
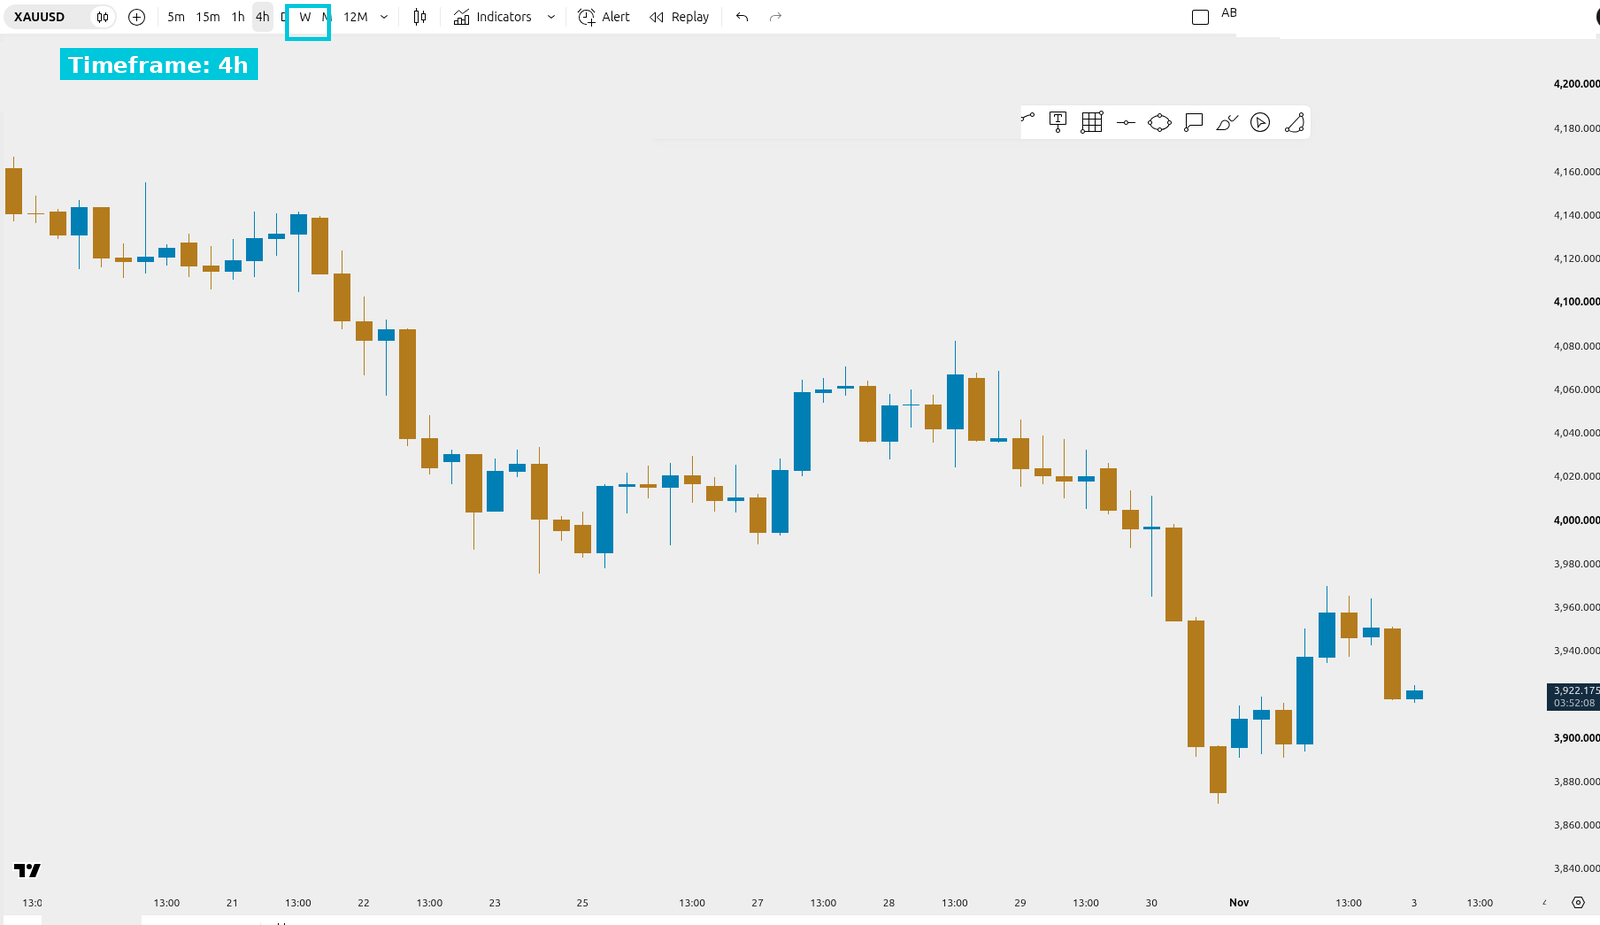
Ek din ke andar kai 4H candles hoti hain — agle steps mein ginti.
Step 6 — 1 Hour (1H)
- Menu se 1 hour / 1h choose karo
- Har candle = 1 ghanta
- Candles aur zyada — din ka andaruni naach clear
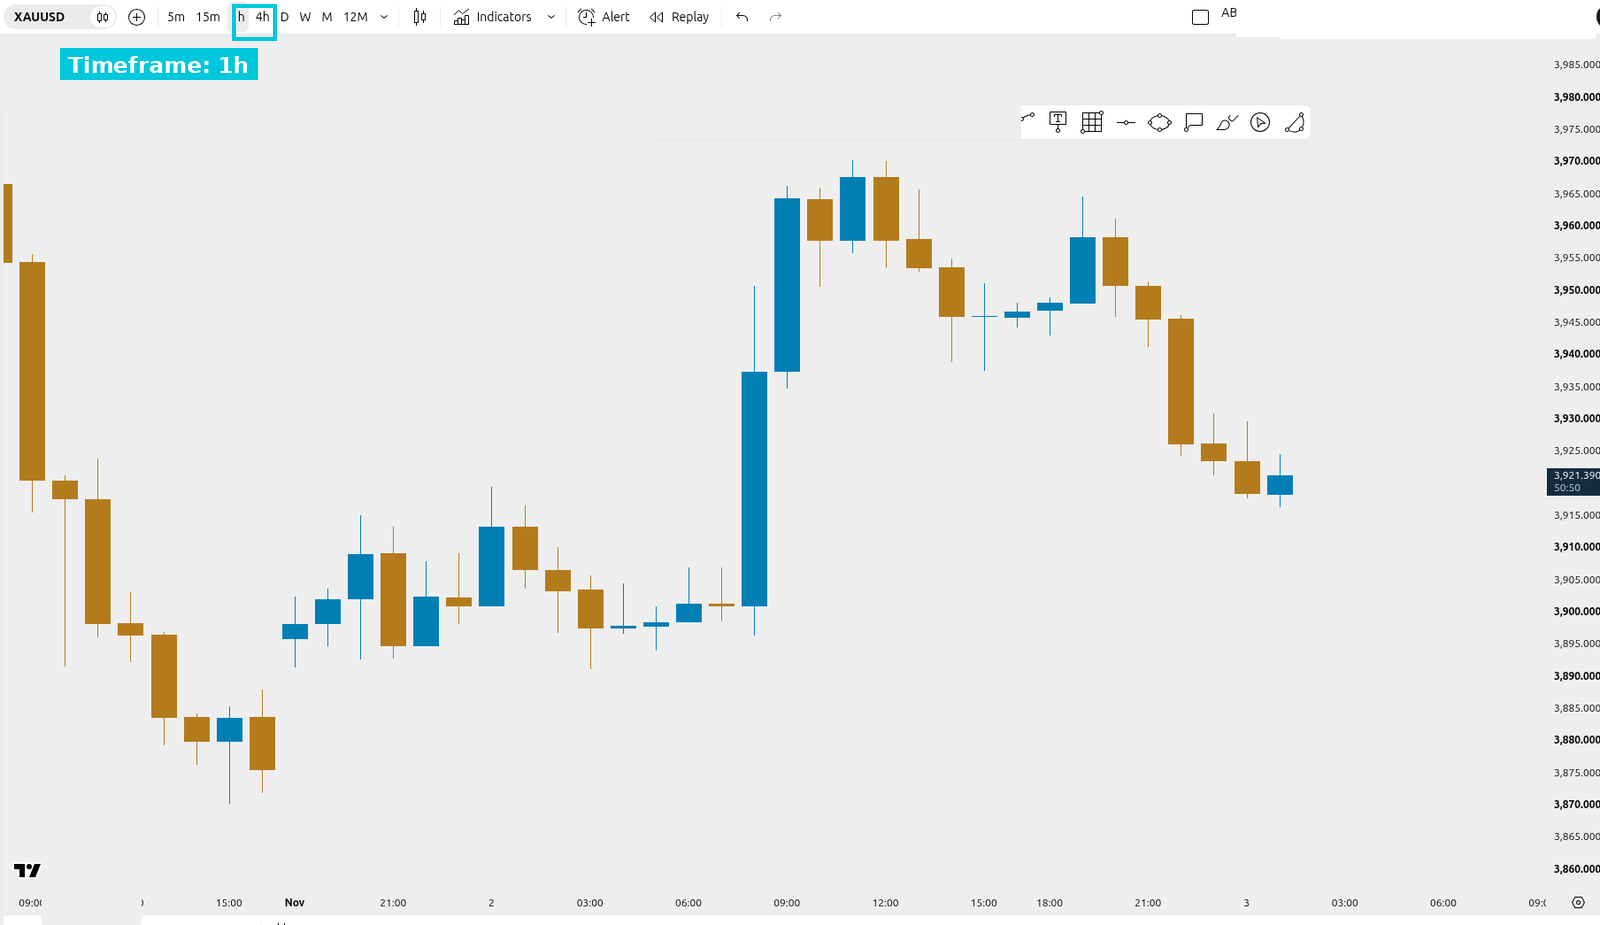
1H pe detail badh jati hai. Pehle bari timeframe dekhe baghair yahan mat uljho.
Step 7 — 5 Minute (5m)
- Menu se 5 minutes / 5m choose karo
- Har candle = sirf 5 minute
- Bohat si chhoti candles — noise zyada, picture tez badalti hai
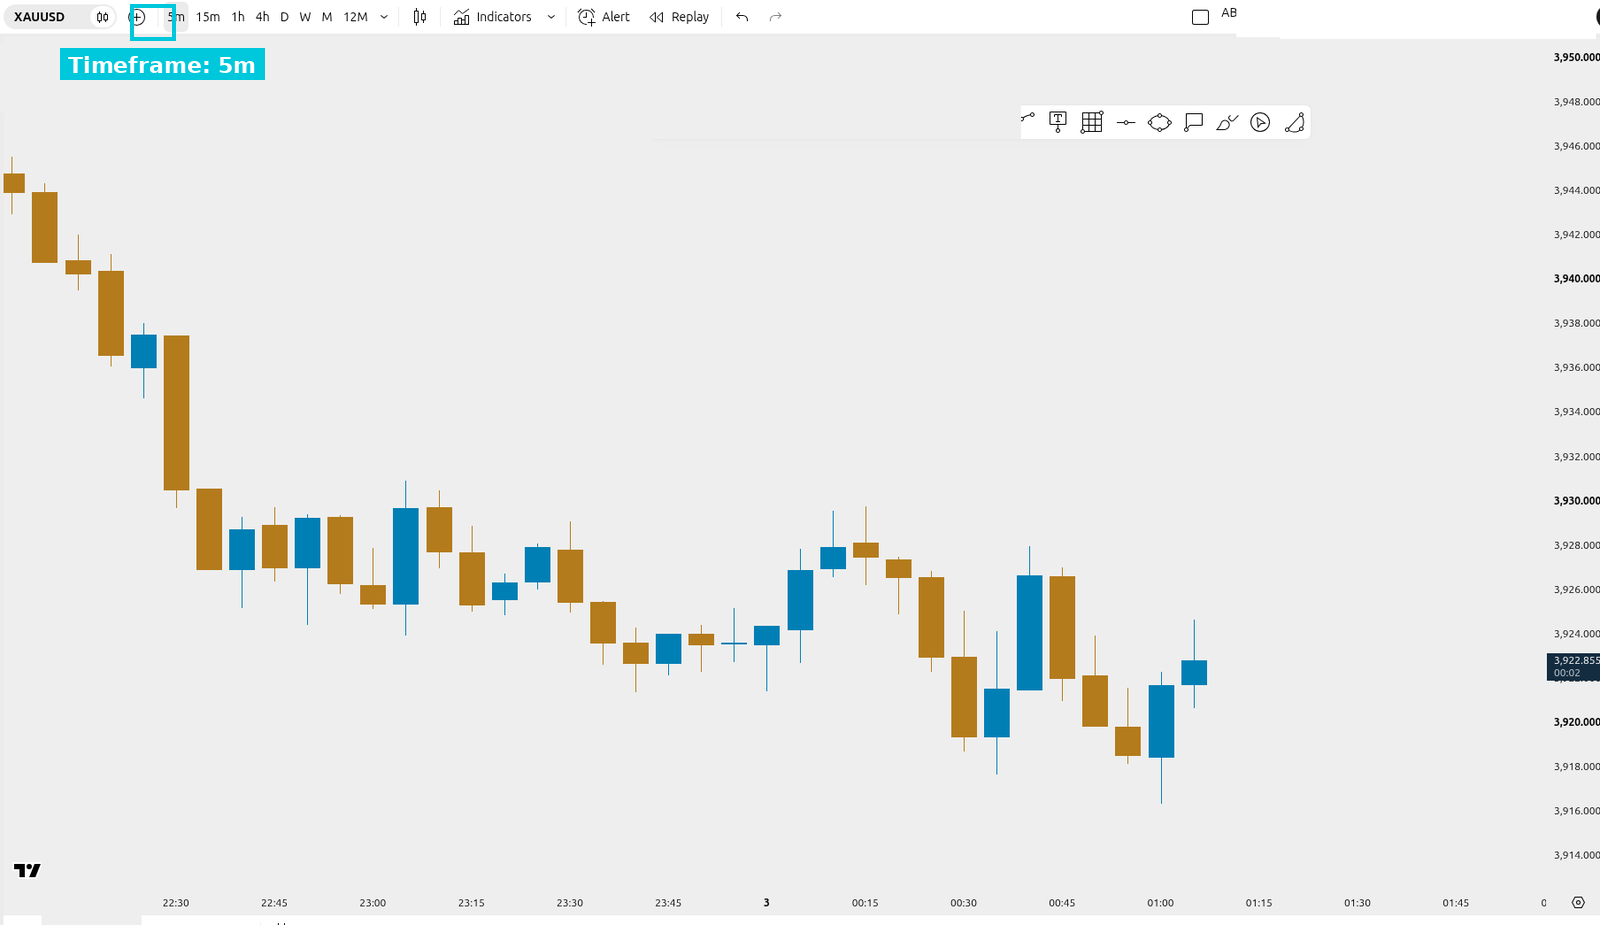
5m beginners ke liye mushkil ho sakti hai. Pehle M → W → 1D samajho, phir neeche ao.
Step 8 — Candle count: 1 Weekly = 5 Daily
- Weekly pe ek candle pe nazar do (green box)
- Wahi hafta 1D pe kholo — 5 daily candles (Monday se Friday)
- Gold weekend band rehta hai — is liye 7 nahi, 5
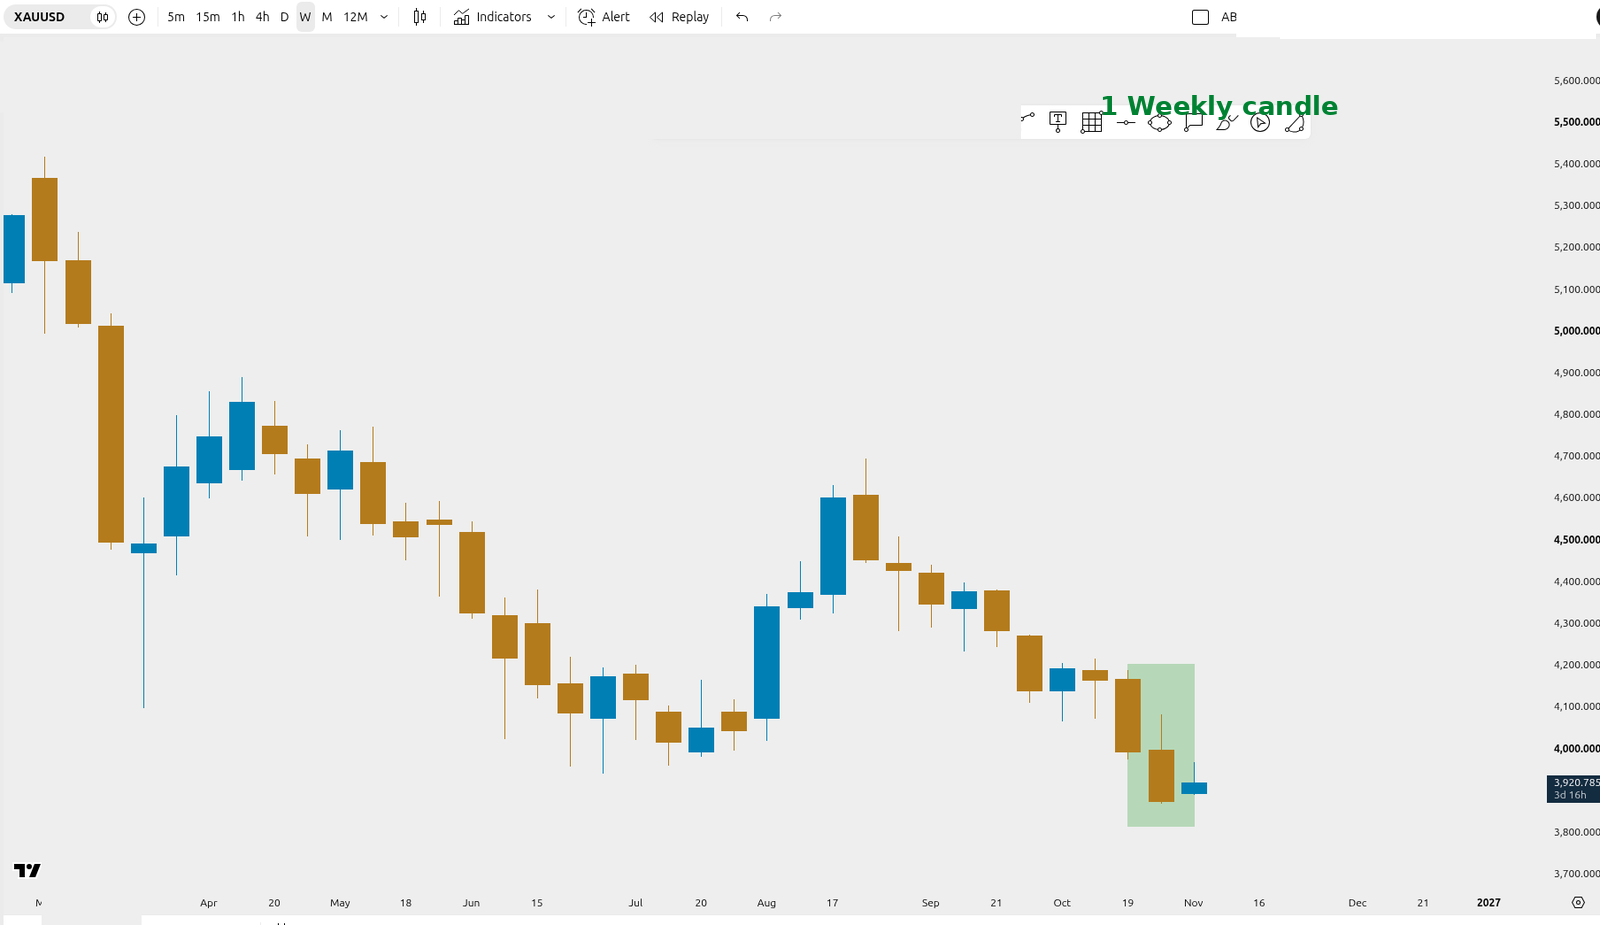
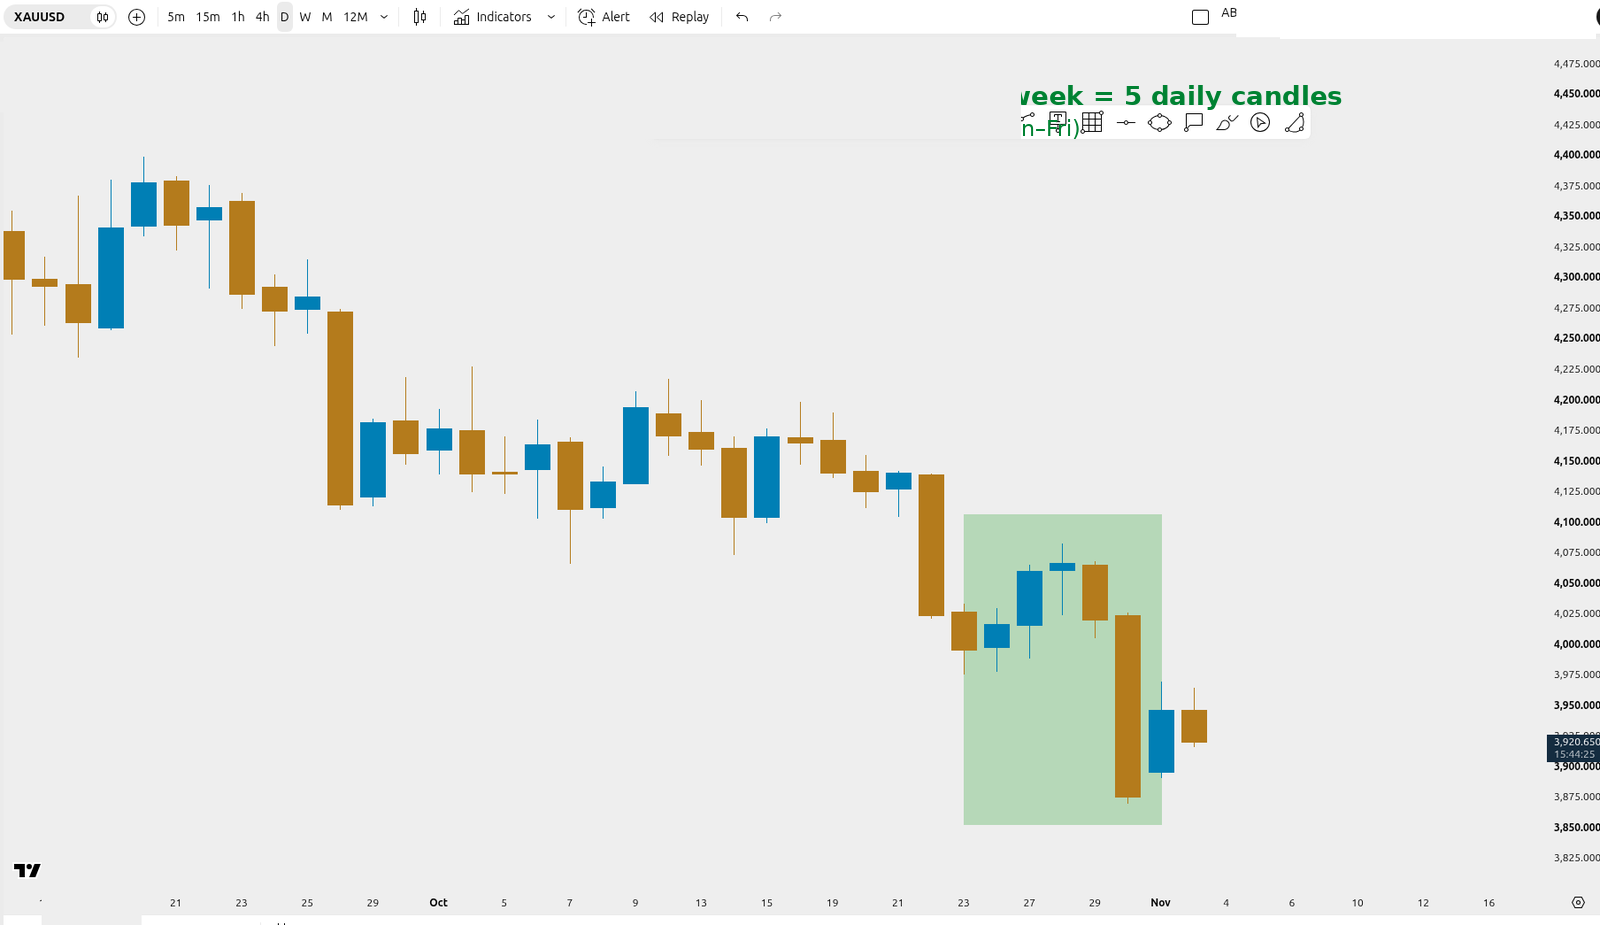
Seedhi baat: badi timeframe ek box hai. Chhoti candles us box ke pieces hain.
Candle count table (Gold)
| Badi candle | Andar ki candles | Time ka hisaab | Gold chart par asal mein |
|---|---|---|---|
| 1 Monthly | 1D | 30–31 din | ~21–22 |
| 1 Weekly | 1D | 7 din | 5 (Mon–Fri) |
| 1D | 4H | 24 ÷ 4 = 6 | 6 (aakhri candle 1 ghanta chhoti) |
| 1D | 1H | 24 | ~23 |
| 4H | 1H | 4 | 4 (break wali candle mein 3) |
| 1H | 5m | 12 | 12 |
Gold ka break: Saturday–Sunday market band. Har din ~1 ghante ka break bhi hota hai — is liye 1D ke andar ~23 one-hour candles aati hain, 24 nahi.
Step 9 — Badi candle ke andar chhoti candles
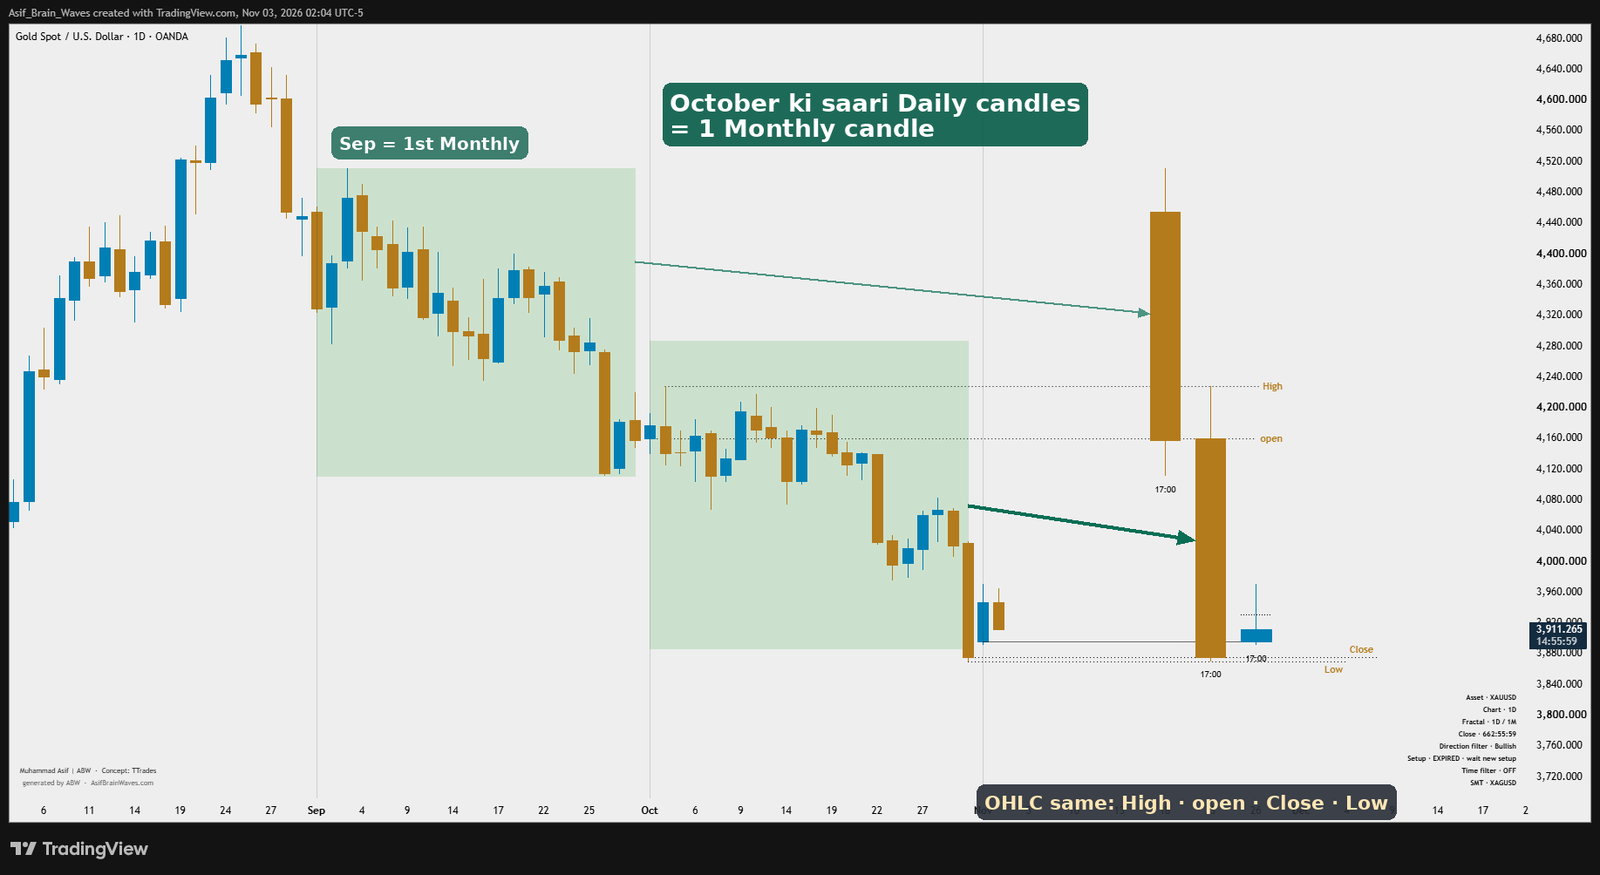
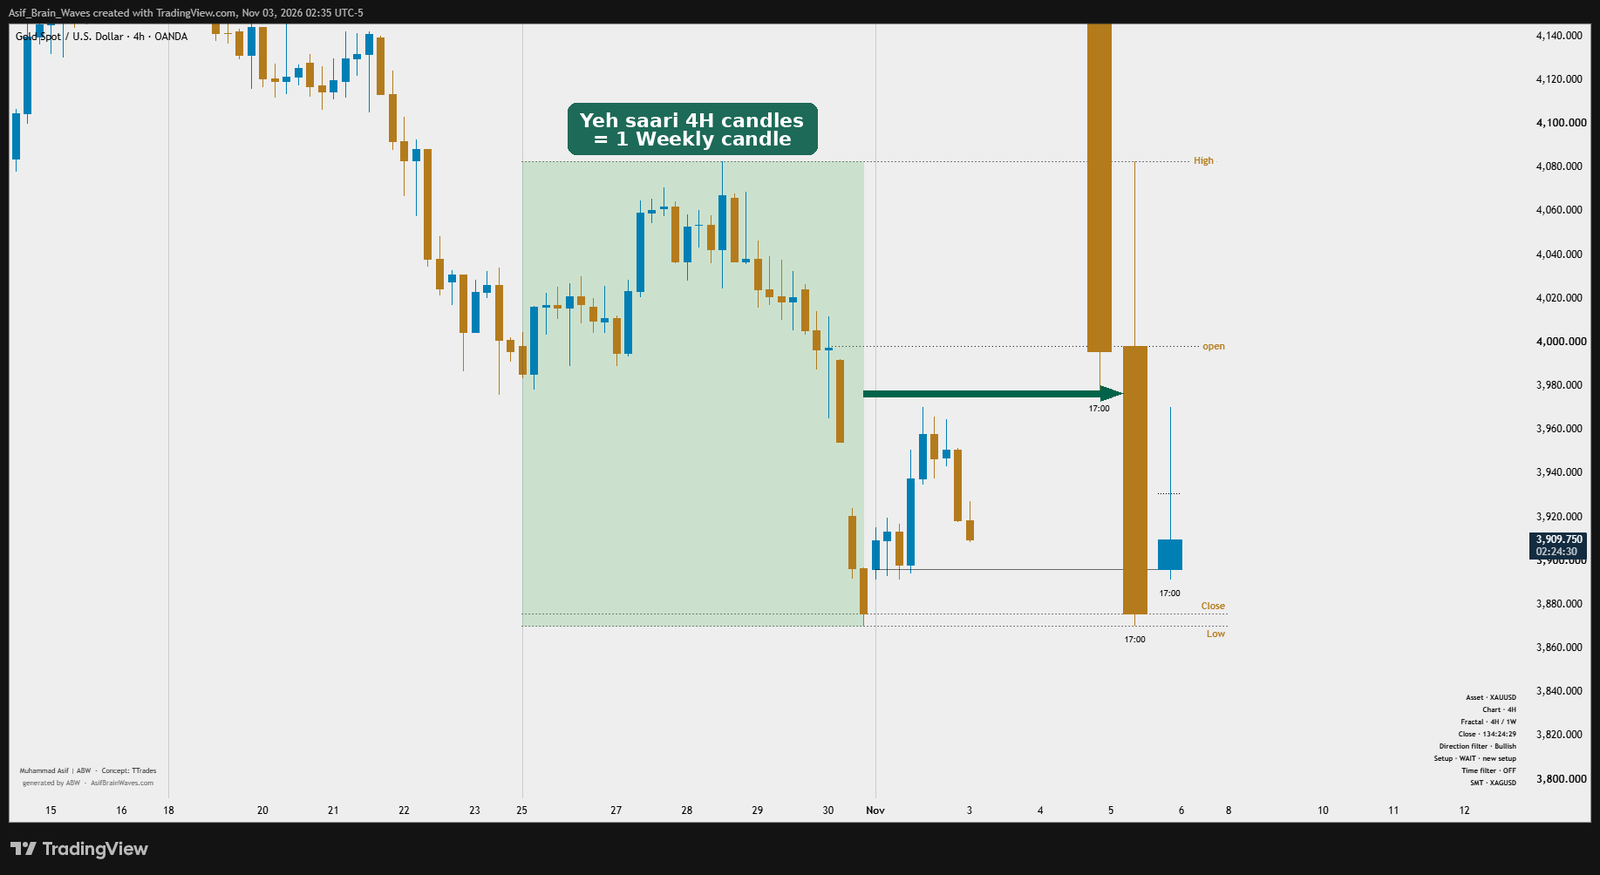
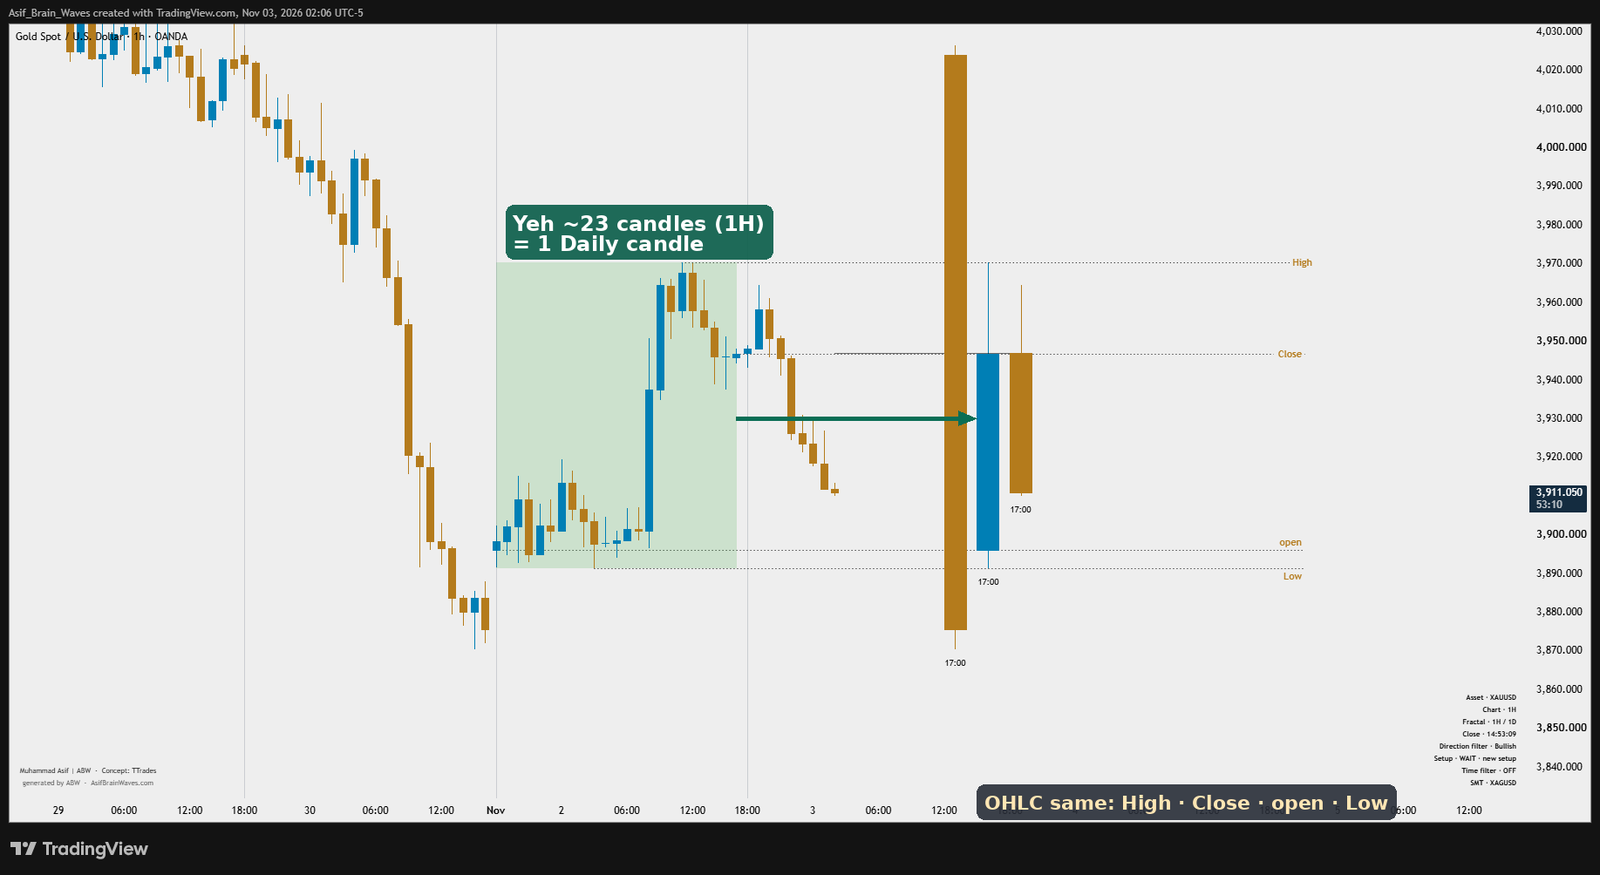
ABW Fractal Model pe ek green box left pe chhoti candles dikhata hai. Right pe badi candle wahi time cover karti hai. Dono ka Open, High, Low, Close same hota hai — sirf 4 prices.
Concept: TTrades. Implementation: ABW. (Poora Fractal course baad mein.)
Har pair mein rule ek hi hai: left box = chhoti candles; right = usi period ki badi candle; dotted lines = High / open / Close / Low.
9a — Monthly ke andar Daily
- Daily (1D) chart — lower timeframe
- Green box = ek mahine ki Daily candles
- Right pe wahi mahina = 1 Monthly candle
- Arrow box se badi candle ki taraf; OHLC lines milti hain
9b — Weekly ke andar 4H
- 4H chart — lower timeframe
- Green box = ek hafta ki 4H candles (Gold pe ~30: 5 din × 6, aakhri candle 1 ghanta chhoti)
- Right pe wahi hafta = 1 Weekly candle
- Wahi 4 prices — High / open / Close / Low
9c — Daily ke andar 1H
- 1H chart — Daily ab higher timeframe
- Green box = ek din ki 1H candles (Gold pe ~23)
- Right pe wahi din = 1 Daily candle
- Phir se wahi 4 prices
9d — 1H ke andar 5m
- 5m chart — 1H higher timeframe
- Green box = 12 five-minute candles (60 ÷ 5 = 12)
- Right pe wahi ghanta = 1 one-hour candle
- Box aur badi candle — same High / open / Close / Low
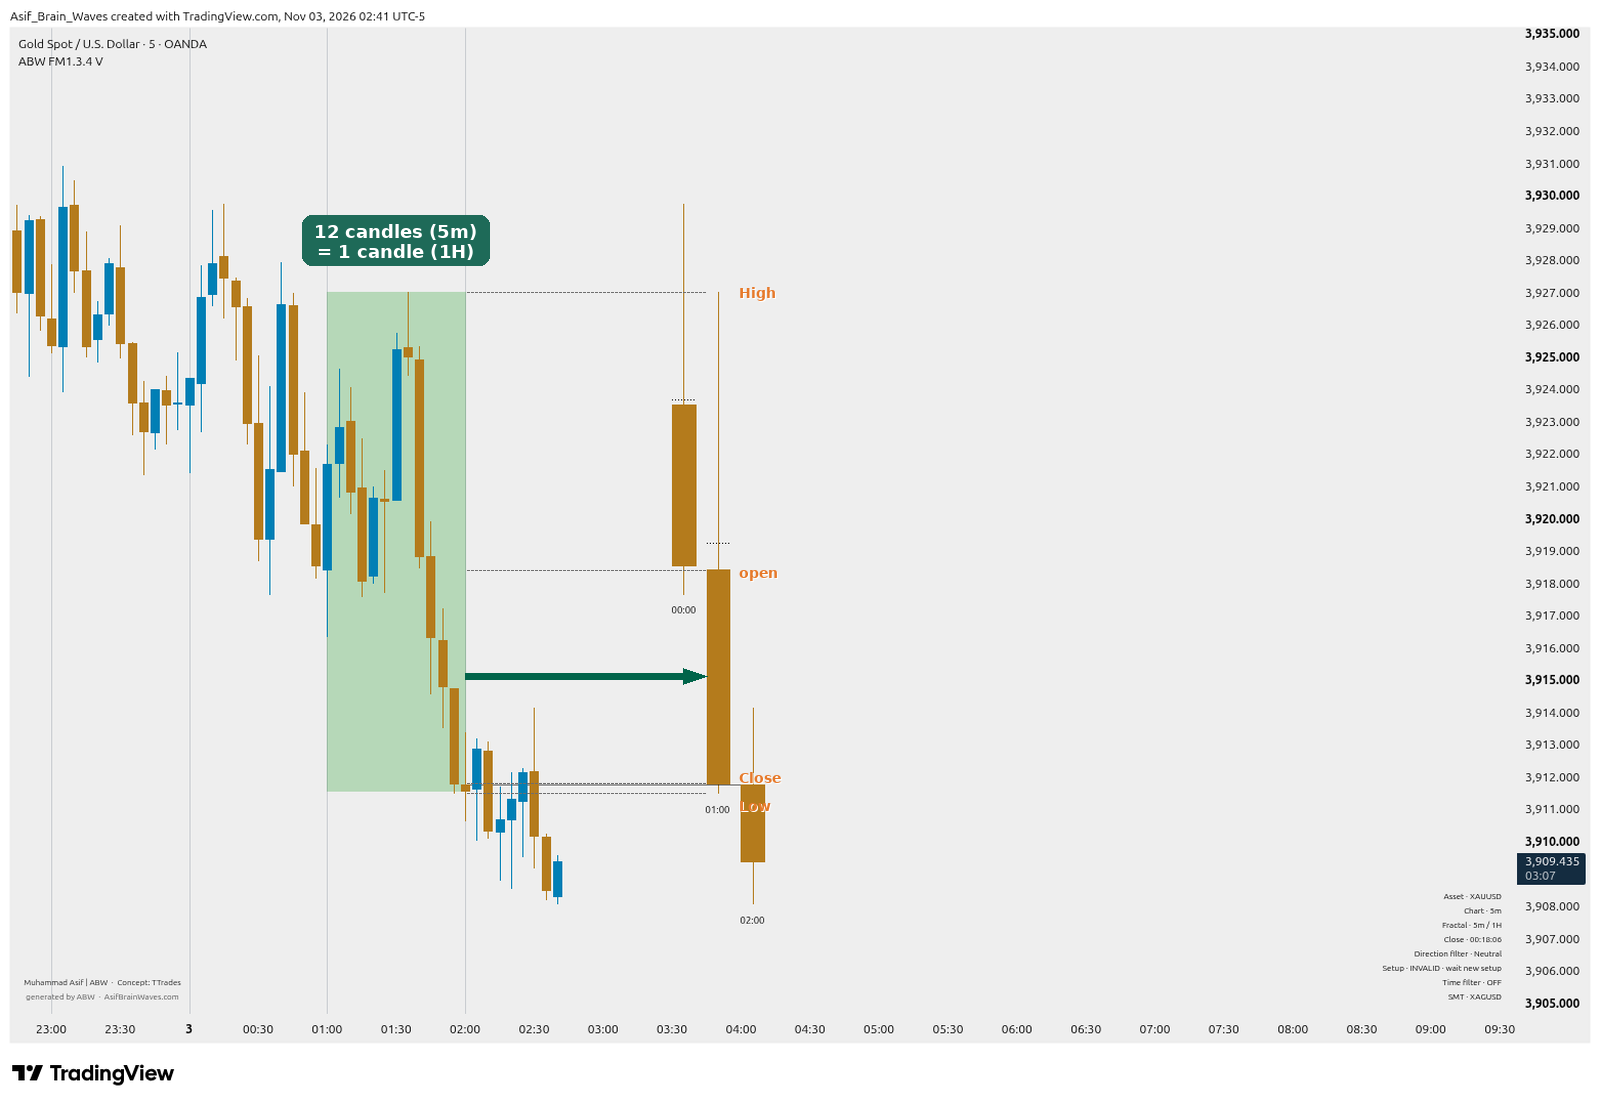
Seedhi baat: left ka box chhoti candles ka hisaab hai; right ki badi candle usi period ka summary hai — 4 prices mil kar. Yeh Lesson 5 (OHLC) ka chhota sneak peek hai.
Step 10 — Lesson 3 wali line: Weekly aur 1H dono pe
- Lesson 3 mein jo horizontal line lagayi thi, woh yaad rakho
- Pehle Weekly pe wahi price level pe line lagao
- Phir 1H pe jao — wahi line wahan bhi dikhegi
- Matlab: ek level kai timeframes pe same rehta hai
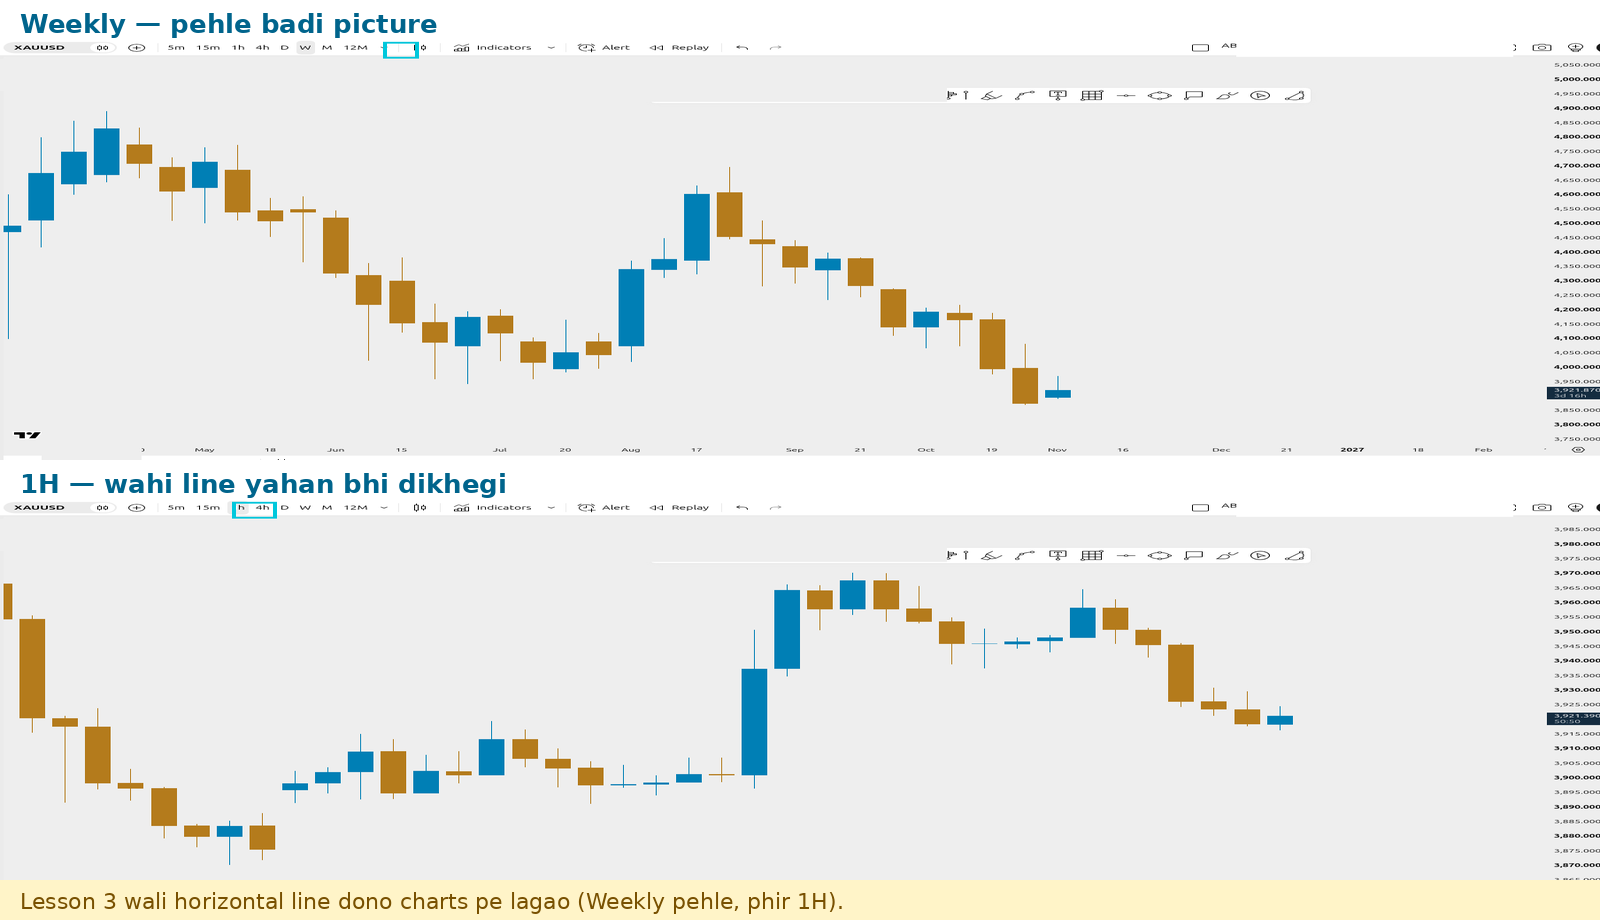
Bari timeframe pe line pehle — phir chhoti pe confirm. Yeh top-down habit hai.
Step 11 — Favourite timeframes star karo
- Timeframe menu dobara kholo
- In ke paas star dabao taake top bar pe chipak jayein: M, W, 1D, 4H, 1H, 5m
- Ab har baar menu nahi kholna — ek click se switch
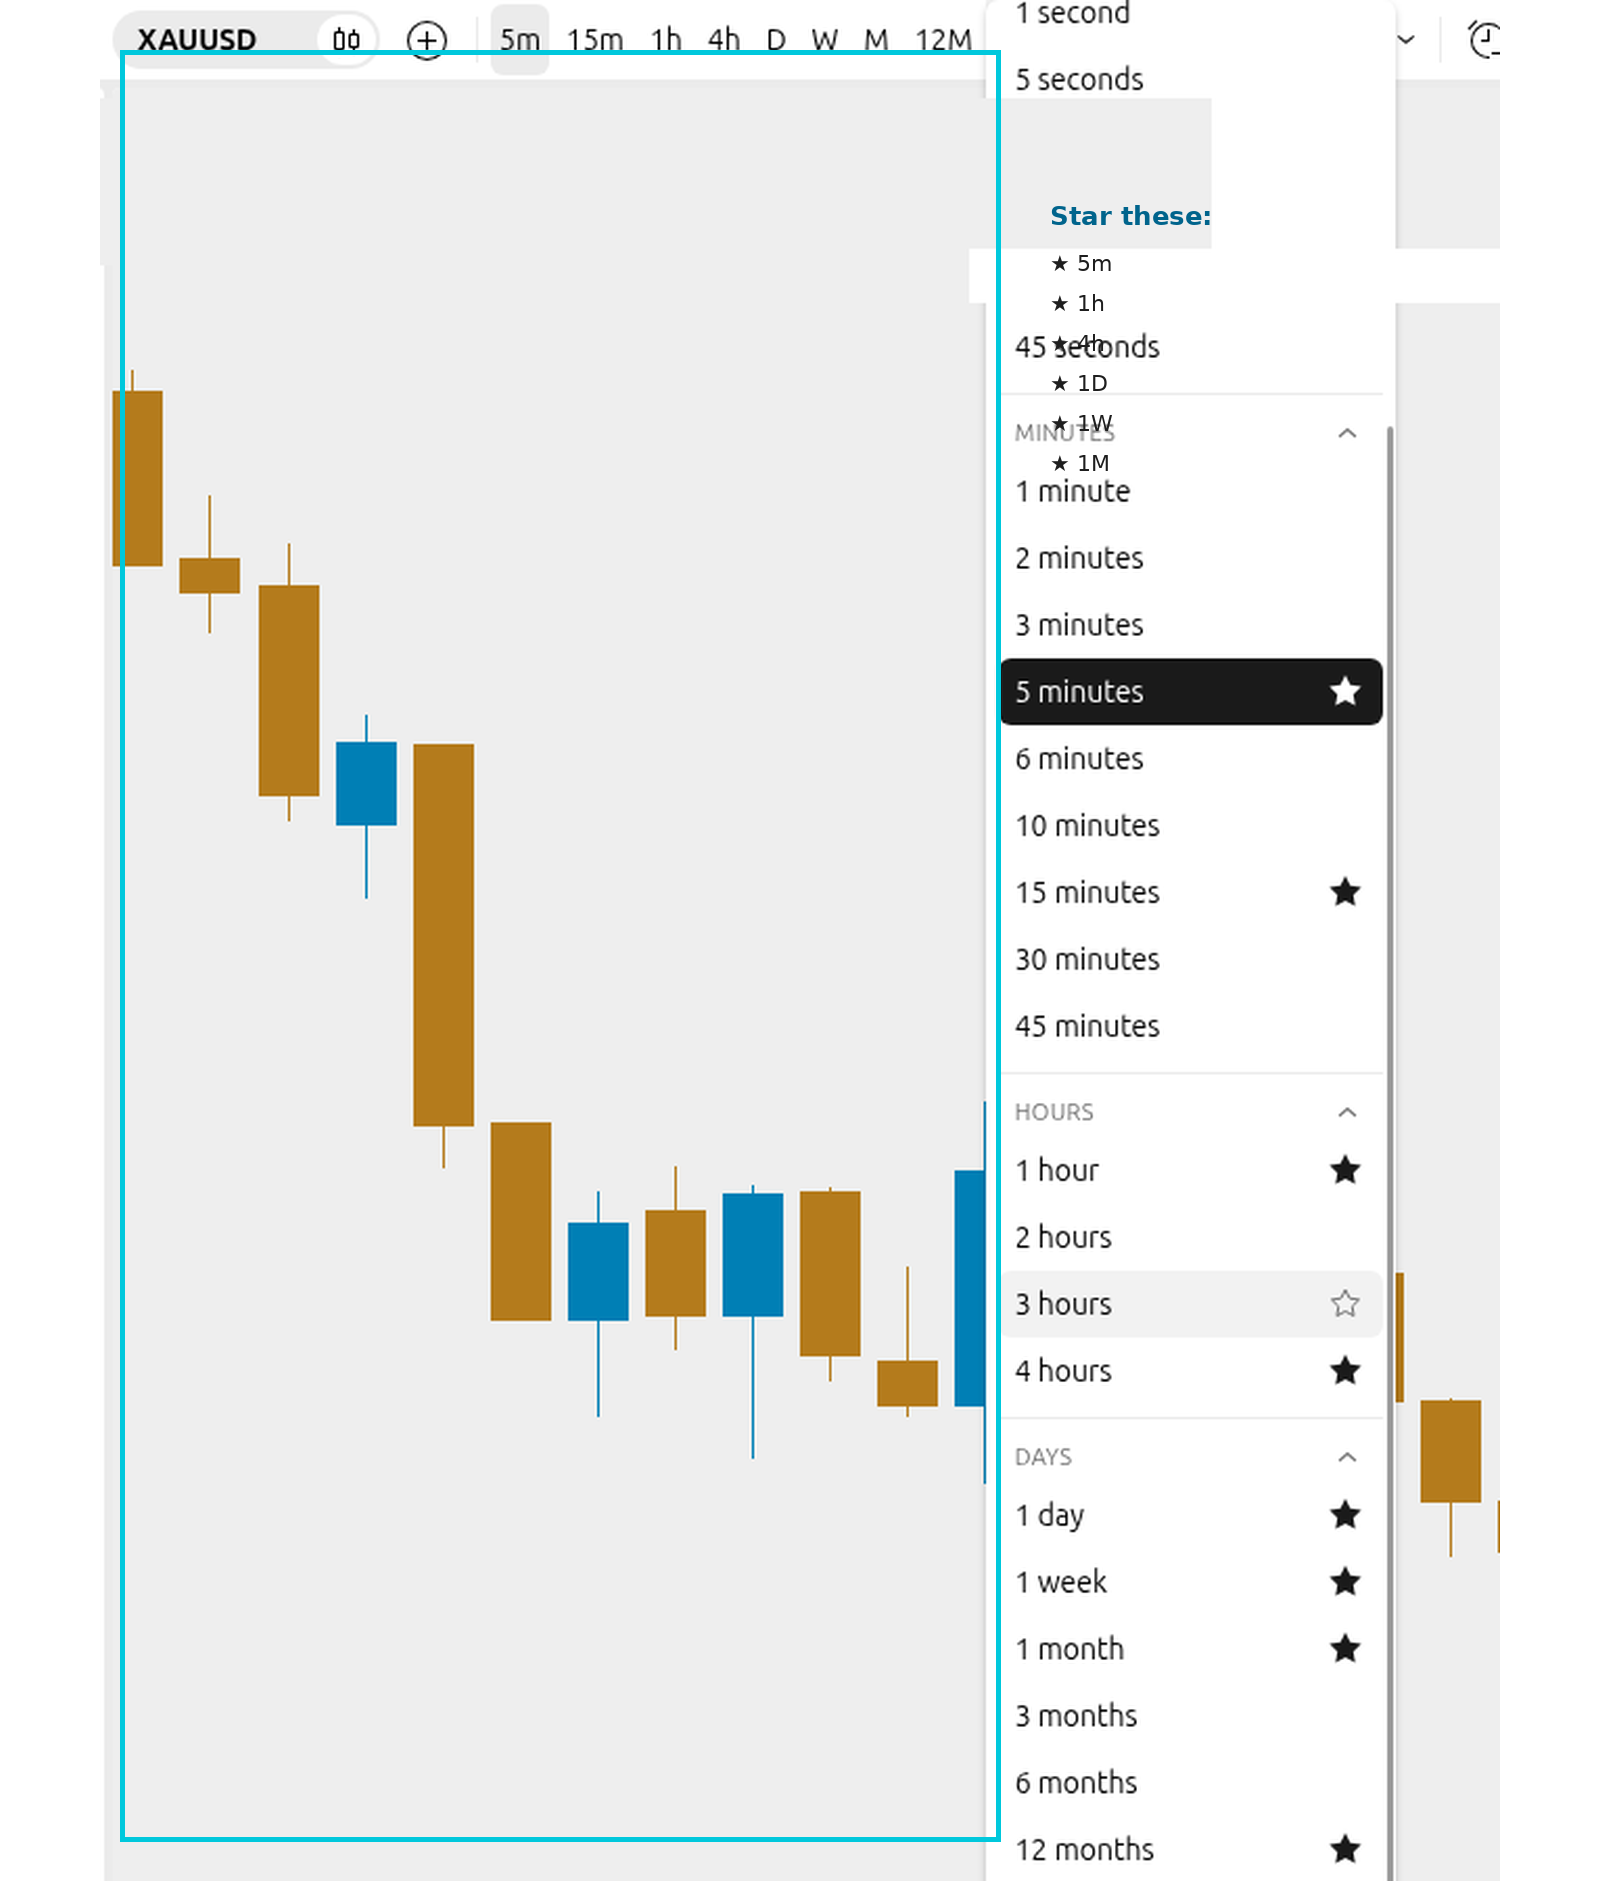
Course ke liye yahi 6 kaafi hain. Baaki baad mein.
- Top-down chalo: pehle Monthly / Weekly / 1D — phir 4H / 1H / 5m
- Badi candle = box; chhoti = uske pieces — table yaad rakho
- Gold weekend band + daily break = ginti clock se thodi alag (~23, na ke 24)
- Fractal Model: left box = chhoti; right = badi (OHLC same) — Monthly/Daily, Weekly/4H, Daily/1H, 1H/5m
- Screenshot mein hamesha XAUUSD + timeframe label clear ho
- Timeframe menu khol kar M, W, 1D, 4H, 1H, 5m dekh liye
- Monthly se 5m tak switch try kiya — candles ka farq clear hai
- Weekly pe 1 candle = 1D pe 5 candles samajh aa gaya
- Table se 1D→1H ~23 aur 1H→5m = 12 yaad hai
- Fractal Model: Monthly↔Daily, Weekly↔4H, Daily↔1H, 1H↔5m — chaar examples dekh liye
- Lesson 3 wali horizontal line Weekly aur 1H dono pe lagayi
- Favourite stars: M, W, 1D, 4H, 1H, 5m
Task (ghar ka kaam)
Upload yeh 2 screenshots:
- TradingView pe XAUUSD kholo
- Screenshot A — Weekly: timeframe W, Lesson 3 wali horizontal line usi price pe
- Screenshot B — 1H: timeframe 1H, wahi horizontal line clear dikhe
- Dono mein upar XAUUSD + timeframe label dikhe
- File: PNG ya JPG, har file 8MB se kam
- Course form pe dono upload karo
Educational only — no profit promises.